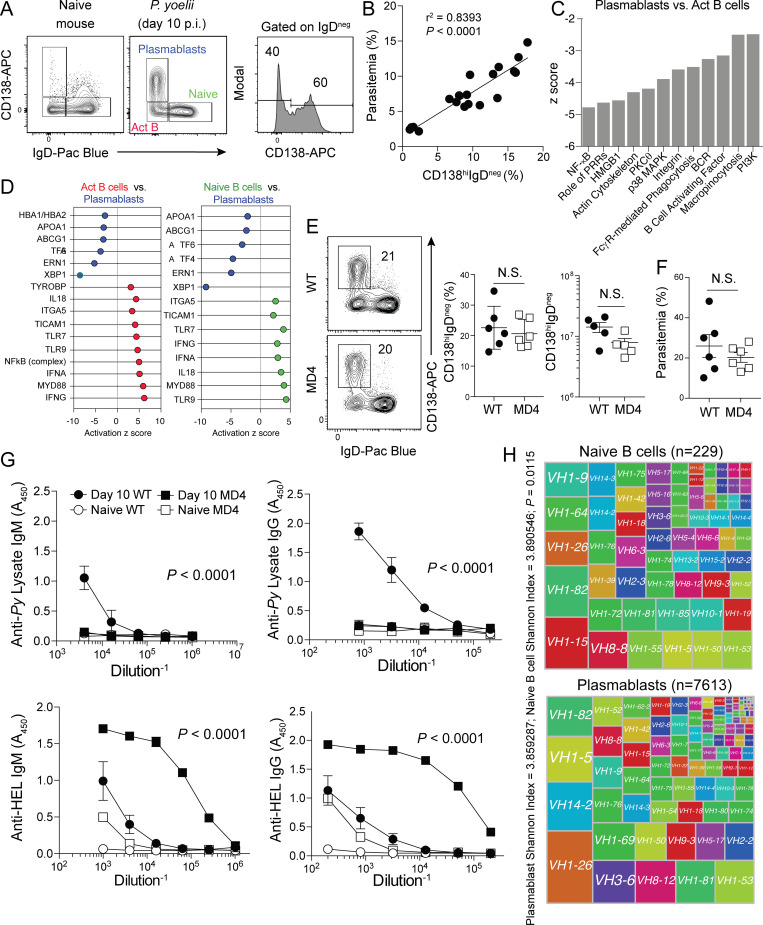
Figure 1.
Plasmablasts can expand independently of antigen–BCR interactions. (A–D) WT mice were infected with 106 Py pRBCs. On days 4, 7, and 10 p.i., parasitemia, plasmablasts (CD138hiIgDneg), activated B cells (CD138loIgDneg), and naive splenic B cell populations (CD138loIgDhi) were quantified (n = 19). Using other WT mice (n = 4), the three B cell populations were sort-purified on day 10 p.i. and RNA sequenced for transcriptomic analysis. (A) Representative gating strategy showing plasmablasts, activated B (Act B) cells, and naive splenic B cells in either naive (left panel) or Py-infected mice (middle panel) on day 10 p.i. (B) Correlation graph showing frequency of plasmablasts (x axis) compared with frequency of infected RBCs (% parasitemia, y axis). (C and D) Canonical pathways and upstream regulators of each phenotype were identified using Ingenuity Pathway Analysis software. (C) Pathways down-regulated (negative activation z score) in CD138hi plasmablasts compared with activated B cells. (D) Left panel: Upstream regulators defining activated B cells (red) in comparison to CD138hi plasmablasts (blue). Right panel: Upstream regulators defining naive B cells (green) in comparison to CD138hi plasmablasts (blue). (E) WT and MD4 mice were infected with 106 Py pRBCs. Representative plots, proportions, and total numbers of CD138hiIgDneg plasmablasts on day 10 p.i. n = 5 or 6 mice/group, mean ± SEM, representative of two biologically independent experiments, analyzed by Mann-Whitney. (F) Parasitemia on day 10 p.i. (G) Anti–parasite lysate–specific IgM and IgG (top row) and anti-HEL–specific IgM and IgG (bottom row) antibody responses in sera from day 10 p.i. Data are mean ± SEM, representative of six independent experiments, analyzed using two-way ANOVA. n = 6 mice/group, mean ± SEM, representative of two biologically independent experiments, analyzed by Mann-Whitney. (H) Treemap diagrams of VH gene usage by naive B cells and plasmablasts recovered from infected mice on day 10 p.i. Shannon index indicates the diversity of the B cells within each population, and the number of cells within each population is listed above the diagrams. P value represents the median P value of 1,000 runs of Jack knife resampling of χ2 tests.

