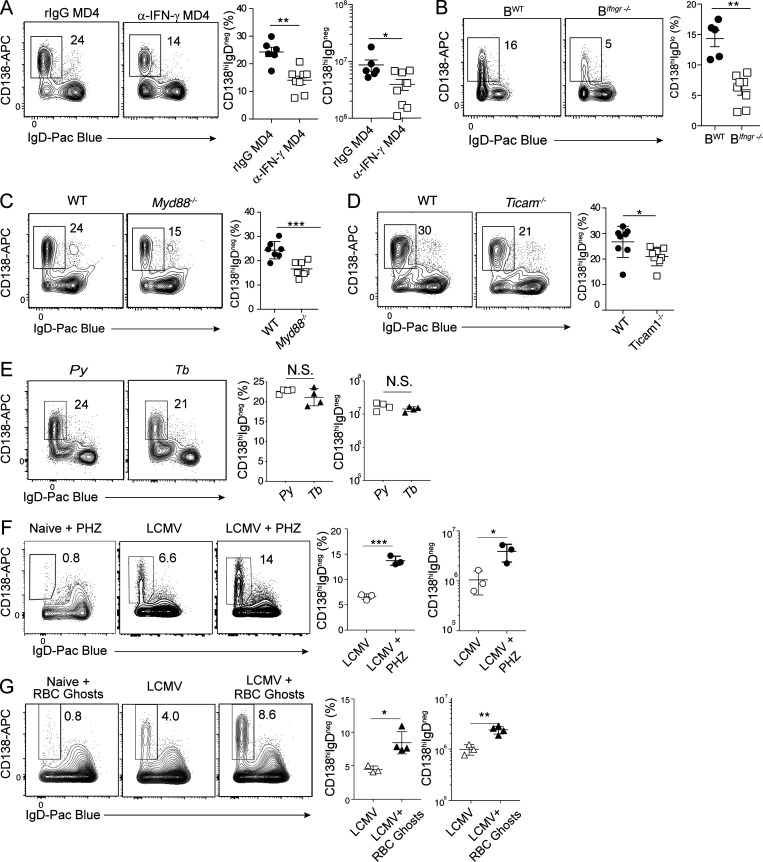
Figure 2.
Hemolysis augments plasmablast differentiation. (A) MD4 mice were infected with 1 × 10⁶ Py pRBCs and administered 500 µg of α-IFN-γ (clone XMG1.2) or rIgG on days 0, 3, 6, and 9 p.i. Representative plots, proportions, and total numbers of CD138hiIgDneg plasmablasts on day 10 p.i. n = 6 (rIgG) and n = 8 (α-IFN-γ) mice/group; mean ± SEM representative of six biologically independent experiments. (B) Representative flow plots and summary of WT or Ifnγr1−/− B cells that differentiate into CD138hiIgDneg plasmablasts in individual BWT and BIfnγr1−/− competitive mixed bone marrow chimeric on day 10 p.i. n = 9 mice, data derived from two pooled experiments. n = 9 mice/group, mean ± SEM, data derived from two pooled experiments. (C) Representative plots and proportions of CD138hiIgDneg plasmablasts on day 10 p.i. in n = 7 (WT) and n = 7 (Myd88−/−) mice/group; mean ± SEM, representative of two biologically independent experiments. (D) Representative plots and proportions of CD138hiIgDneg plasmablasts on day 10 p.i. in n = 8 (WT) and n = 8 (Ticam1−/−) mice/group; mean ± SEM, representative of two biologically independent experiments. (E) Representative plots and summary graphs showing splenic plasmablasts (CD138hiIgDneg) in Py and Tb infection on day 10 p.i. n = 4 mice/group; mean ± SD, representative of two biologically independent experiments. (F) Representative plots and summary graphs showing splenic plasmablasts (CD138hiIgDneg) on day 10 p.i. following LCMV infection with or without PHZ treatment. n = 3 mice/group; mean ± SD, representative of two biologically independent experiments. (G) Representative plots and summary graphs showing splenic plasmablasts (CD138hiIgDneg) on day 10 p.i. following LCMV infection with or without RBC ghost administration. n = 4 mice/group; mean ± SD, representative of two biologically independent experiments. Significance was calculated using Mann-Whitney (A, C–E, and G), paired t test (B), and Student’s t test (F). *, P < 0.05; **, P < 0.01; ***, P < 0.001.

