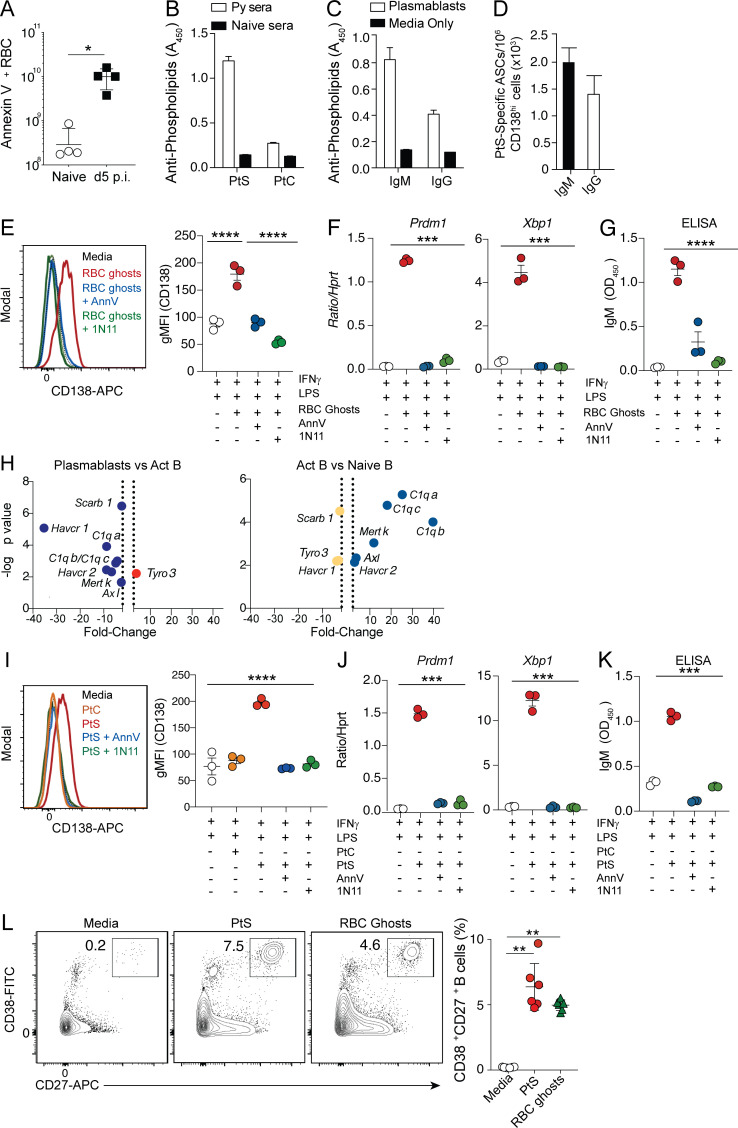
Figure 3.
PtS promotes plasmablast formation. (A) Summary graph showing the number of Annexin V–positive RBCs/ml of blood in naive and Py-infected mice as a measure of PtS exposure. n = 4 mice/group; mean ± SD, representative of two biologically independent experiments. (B) Detection of PtS- and PtC-specific IgM antibodies in sera (1:100 dilution) of day 10 Py–infected mice or naive WT mice. n = 10 mice; mean ± SEM, pooled from four independent experiments. (C and D) Sort-purified CD138hiIgDneg plasmablasts from day 10 Py-infected mice were cultured for 20 h, and parasite lysate–specific IgM- and IgG-secreting antibody-secreting cells were detected by ELISA (C) or ELISPOT (D). n = 6 mice; mean ± SEM, pooled from two independent experiments. (E–G) B cells from naive mice were cultured ex vivo for 3 d in media containing IFN-γ and LPS in the presence or absence of RBC ghosts or RBC ghosts plus Annexin V (AnnV) or RBC ghosts plus mch1N11. Representative histograms and summary data showing geometric mean fluorescence intensity (gMFI) of CD138 expression (E), summary data comparing mRNA expression of Prdm1 and Xbp1 relative to Hprt (F), and IgM antibody titers in the supernatant as detected by ELISA (G). n = 3 mice/group, mean ± SEM. Each data point reflects the mean of two technical replicates; data are representative of four biologically independent experiments. (H) Volcano plot showing relative expression of receptors capable of binding to PtS when comparing either plasmablasts and activated B (Act B) cells (left) or activated B cells and naive B cells (right). Dotted vertical lines demarcate positive versus negative log2(fold change). (I–K) B cells from naive mice were cultured ex vivo for 3 d in media containing IFN-γ and LPS in the presence or absence of PtC or PtS liposomes or PtS liposomes plus AnnV or PtS liposomes plus mch1N11. Representative histograms and summary data showing gMFI of CD138 expression (I), summary data comparing mRNA expression of Prdm1 and Xbp1 relative to Hprt (J), and IgM antibody titers in the supernatant as detected by ELISA (K). n = 3 mice/group, mean ± SEM. Each data point reflects the mean of two technical replicates; data are representative of four biologically independent experiments. (L) Representative plots showing the differentiation of CD38+CD27+ human plasma cells from naive peripheral B cells cultured ex vivo in the presence of PtS liposomes or autologous RBC ghosts. n = 2 human leukocyte reduction system (LRS) blood cones with three wells/treatment group; mean ± SEM, data are representative of two biologically independent experiments. Significance was calculated using one-way ANOVA (E–G and I–K) and Mann-Whitney test (A and L). *, P < 0.05; **, P < 0.01; ***, P < 0.001; ****, P < 0.0001.

