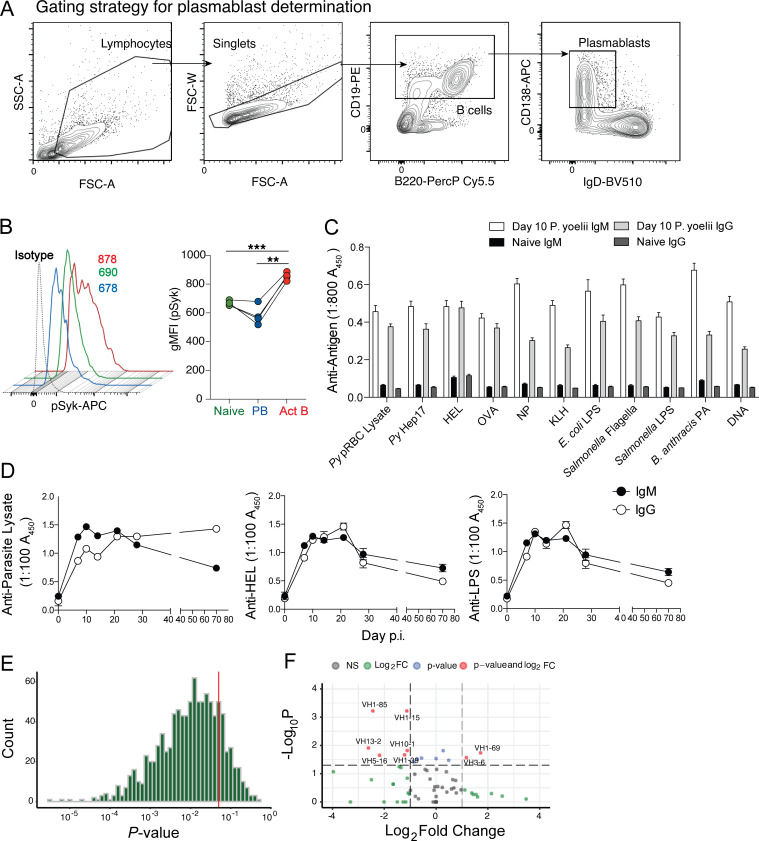
Figure S1.
Cytometry gating strategy, phosphoflow, serum ELISA data, and statistical analyses of single-cell RNA sequencing data. (A) Gating strategy for identifying plasmablasts is shown. (B) Py-infected WT mice were harvested on day 6 p.i., and the B cell populations were evaluated for phosphorylation of Syk. Representative histograms and summary graphs showing geometric mean fluorescence intensity (gMFI) of pSyk on B cell subsets are shown. (C) Sera were collected from Py-infected WT mice on day 10 p.i., diluted 1:800, and reacted against the indicated parasite-, model-, microbial-, and self-specific antigens. n = 20 mice. Data are mean ± SEM, pooled from five biologically independent experiments. (D) Longitudinal analyses of parasite lysate- (top), HEL- (bottom left), and LPS- (bottom right) specific serum IgM and IgG titers in Py-infected mice. n = 6 mice/time point; mean ± SEM pooled from two biologically independent experiments, analyzed by Mann-Whitney. (E) Histogram of P value results of 1,000 Jack knife resampling χ2 tests. (F) Volcano plot of VH loci expressed by plasmablast population relative to naive B cell repertoire. Act B, activated B; FC, fold change; FSC-A, forward scatter area; FSC-W, forward scatter width; NP, (4-hydroxy-3-nitrophenyl)acetyl antigen; PA, protective antigen; PB, plasmablast; PerCP, peridinin-chlorophyll-protein; scRNA, single-cell RNA; SSC-A, side scatter area.

