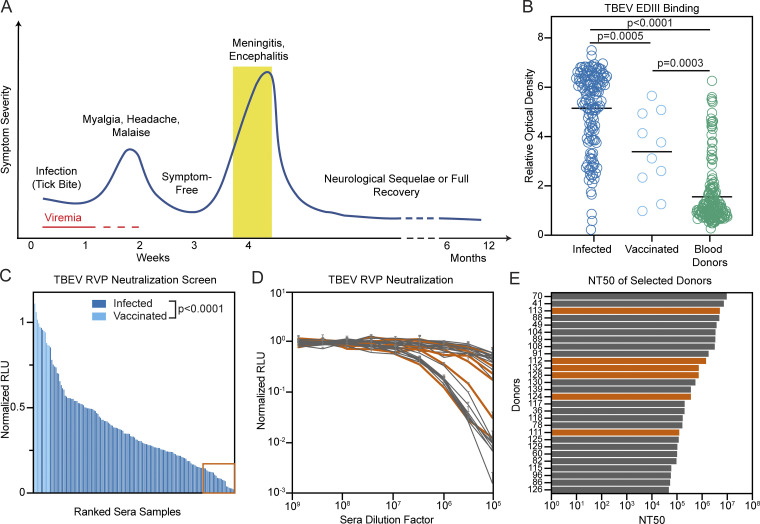
Figure 1.
Screening individuals for TBEV antibodies. (A) Diagrammatic representation of the clinical course of TBE. The approximate time of serum collection is shown in yellow. (B) TBEV EDIII IgG ELISA. Graph shows optical density measurement (y axis) relative to a negative control serum for samples from 141 TBEV-infected individuals, 10 TBEV vaccinees, and 168 random blood donors (1:500 dilution) measured in singlicate. P = 0.0005 for infected versus vaccinees; P < 0.0001 for infected versus blood donors; P = 0.0003 for vaccinees versus blood donors; calculated by one-way ANOVA followed by Tukey’s test. Horizontal lines indicate the mean. (C) TBEV RVP neutralization screening. Graph shows ranked serum neutralizing activity (1:600,000 dilution) against TBEV RVPs (average of duplicate wells) relative to no serum control. The orange box (bottom right) indicates the 28 best neutralizers of 141 TBEV-infected individuals and 10 TBEV vaccinees tested. P < 0.0001; calculated using two-tailed Mann–Whitney test. (D) TBEV RVP neutralization curves. Plot shows representative neutralization curves for each of the 28 most potent sera from C. Representative of two experiments, each performed in triplicate. Error bars indicate standard deviation. (E) Ranked NT50s for the top 28 individuals. Average of two independent experiments. In D and E, orange indicates the donors of PBMCs for antibody cloning. Related to Fig. S1 and Table S1. RLU, relative light units.

