Figure 2.
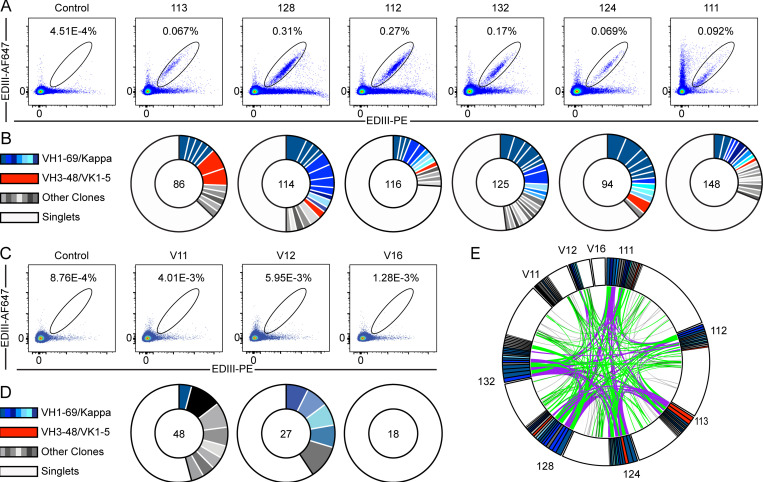
Anti-TBEV antibodies from infected and vaccinated individuals. (A) Identification of TBEV-specific B cells from infected donors. Representative flow cytometry plots showing B cells binding to AF647- and PE-labeled TBEV EDIII in one control and six TBEV-infected donors. Numbers indicate percentage of double-positive B cells. The gating strategy is shown in Fig. S2 A. (B) Clonal analysis of antibody sequences. Pie charts show the distribution of antibody sequences from infected donors. The number in the center represents the total number of antibody sequences obtained. Colored or gray pie slices correspond to clonally related sequences, with the size of the slice proportional to the number of sequences. All blue slices are IGVH1–69, and all red slices are IGVH3–48/IGVK1–5. White slices correspond to antibody sequences that are not part of a clone (singlets). (C and D) Same as in A and B, but for one healthy control and three vaccinated donors. (E) Antibody sequence relatedness. Circos plot shows sequences from all donors, with color-coding as in B and D. Connecting lines indicate antibodies that share IGH and IGL V and J genes. Purple, green, and gray lines connect related clones to each other, clones to singlets, and singlets to singlets, respectively. Related to Figs. S2 and S3, Table S2, and Table S3.

