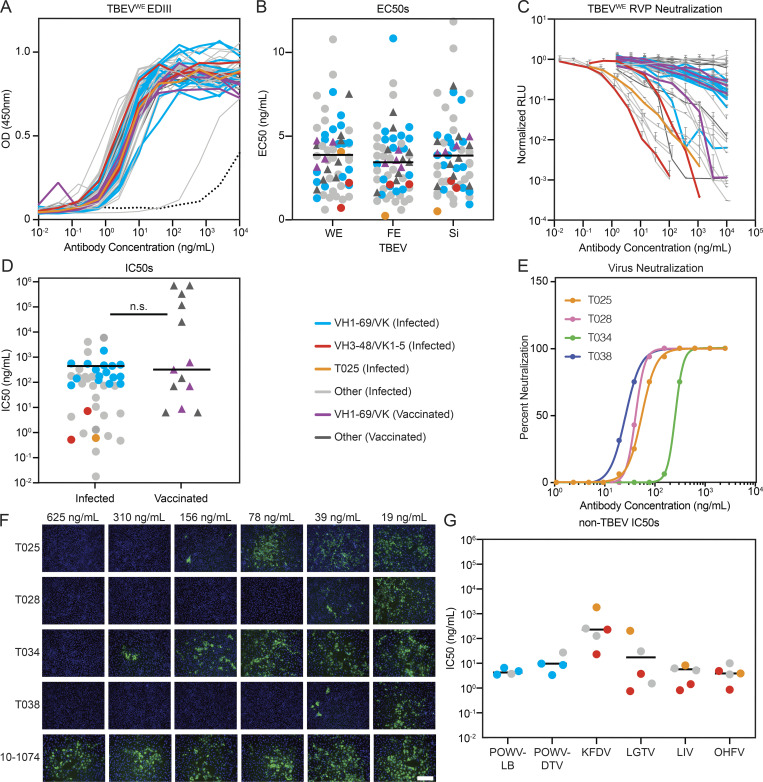
Figure 3.
Identification of potent and broadly cross-reactive monoclonal antibodies. (A) TBEVWE EDIII ELISA binding curves for 46 and 13 monoclonals from infected and vaccinated individuals, respectively. Data are representative of two experiments performed in singlicate. Dotted line is 10–1074 isotype control. (B) Dot plot summarizing average EC50 values for the antibodies in A to each of three TBEV subtype EDIIIs: TBEVWE, TBEVFE, and TBEVSi. Average of two experiments. The horizontal lines indicate the mean value. (C) RVP neutralization curves for the antibodies in A normalized to no antibody control. Data are representative of two experiments, each performed in triplicate. Error bars indicate standard deviation. (D) Dot plot summarizing the average IC50 for TBEVWE RVP neutralization by the antibodies as in C. Horizontal line indicates the mean IC50. No statistical difference was found by two-tailed Mann–Whitney test. (E and F) TBEV neutralization in vitro. In E, curves represent virus neutralization by serially diluted antibodies. Representative of two independent experiments performed in octuplicate. In F, representative immunofluorescence microscopy images of PS cells infected in the presence of the indicated antibodies are shown. Green is viral antigen, and blue is cell nuclei. Scale bar indicates 200 µm. (G) Cross-neutralization by anti-TBEV antibodies. Graph shows IC50s for selected antibodies against RVPs corresponding to POWV-LB, POWV-DTV, KFDV, LGTV, LIV, and OHFV. Average of two independent experiments performed in triplicate. Horizontal line indicates the mean IC50. In A–D and G, blue and red indicate infected donor-derived IGVH1–69/kappa and IGVH3-48/IGVK1–5 antibodies, while purple indicates IGHV1–69/kappa antibodies from vaccinated individuals. Antibody T025 is shown in orange. In B, D, and G, circles and triangles correspond to antibodies derived from infected or vaccinated donors, respectively. Related to Fig. S4, Table S4, and Table S5.

