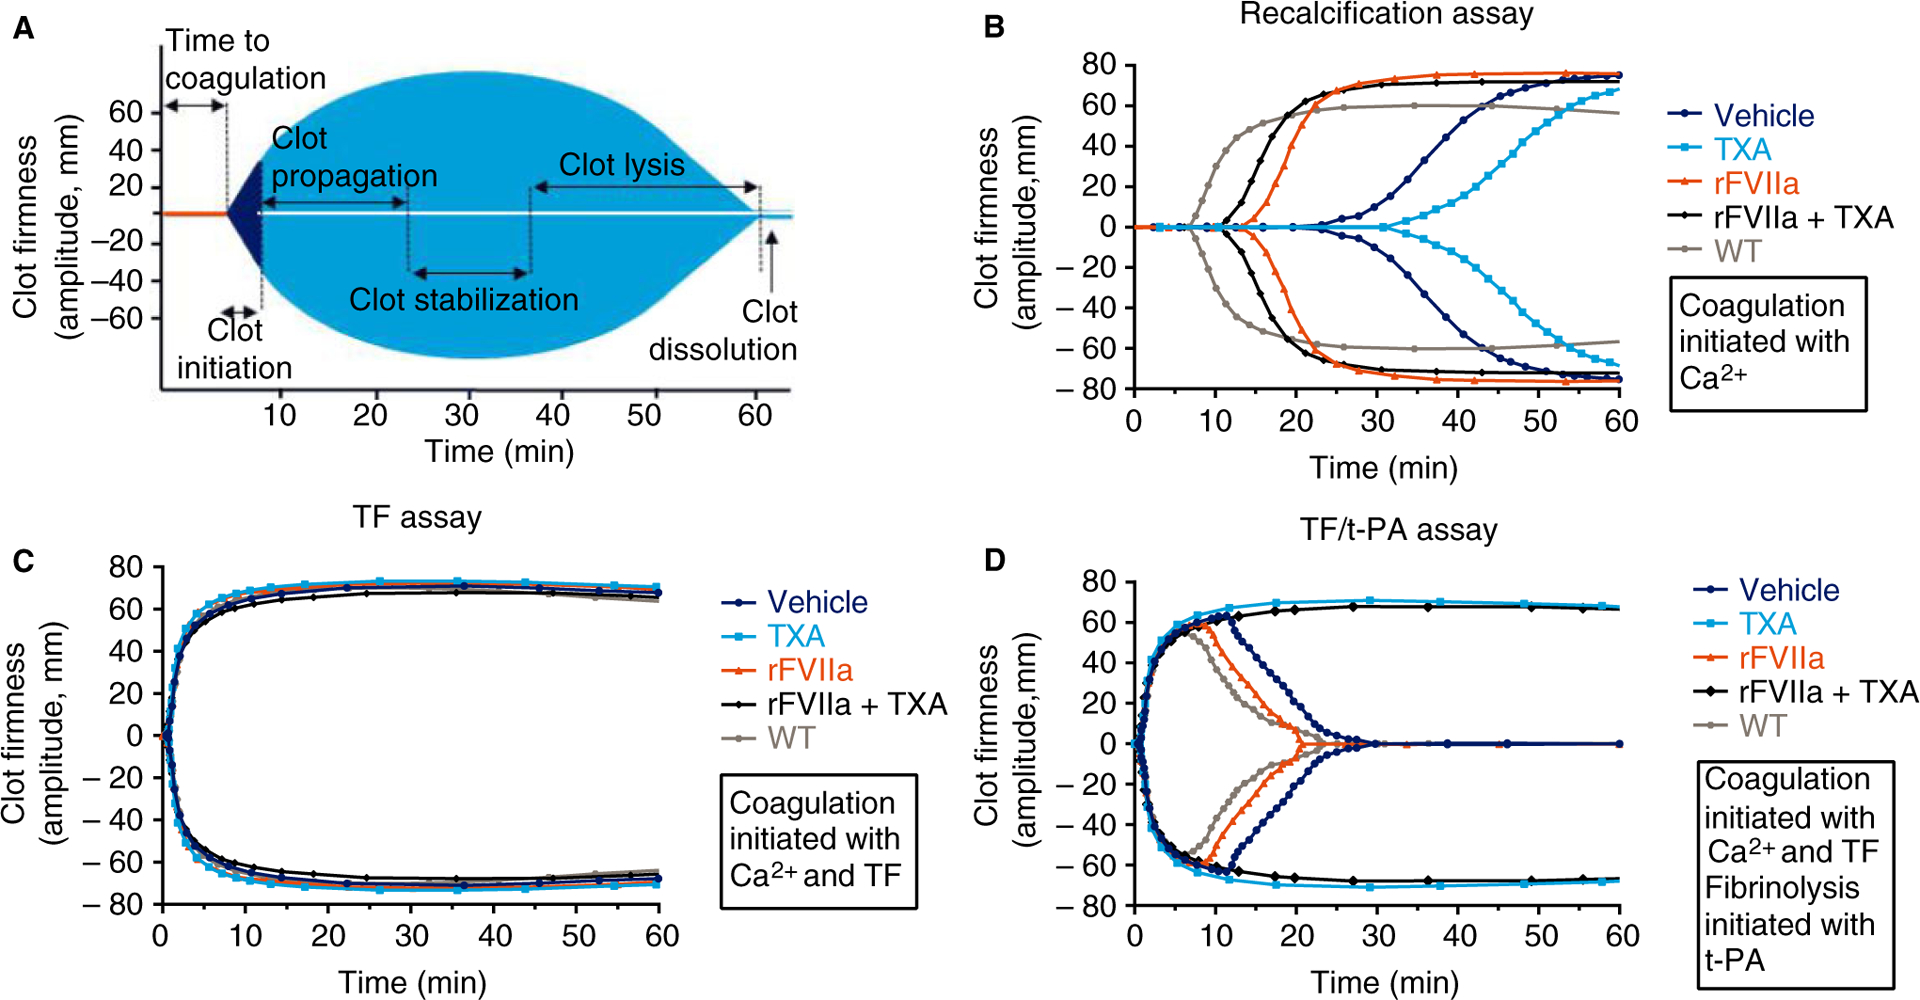
Fig. 1.

Schematic depiction and representative examples of rotational thromboelastometry (ROTEM) traces recorded during recalcification, tissue factor (TF) and TF/tissue-type plasminogen activator (t-PA) ROTEM assays with whole blood from treated FVIII−/− rats. (A) Schematic depiction of a ROTEM curve that demonstrates where clot initiation, propagation, stabilization, lysis and dissolution of a formed thrombus can be detected. (B) Representative examples of recorded ROTEM traces from the recalcified whole blood assay, which assesses global clot formation. (C) Representative examples of recorded ROTEM traces for the TF assay, which assesses global clot formation following activation of coagulation with TF. (D) Representative examples of ROTEM traces for the TF/t-PA assay, which assesses the formation and stability of clots following addition of t-PA to all blood samples. Each trace in (B), (C) and (D) shows the rat whole blood sample that best represented its treatment group on the basis of mean clotting time and maximum clot firmness results. rFVIIa, recombinant activated factor VII; TXA, tranexamic acid; WT, wild-type.
