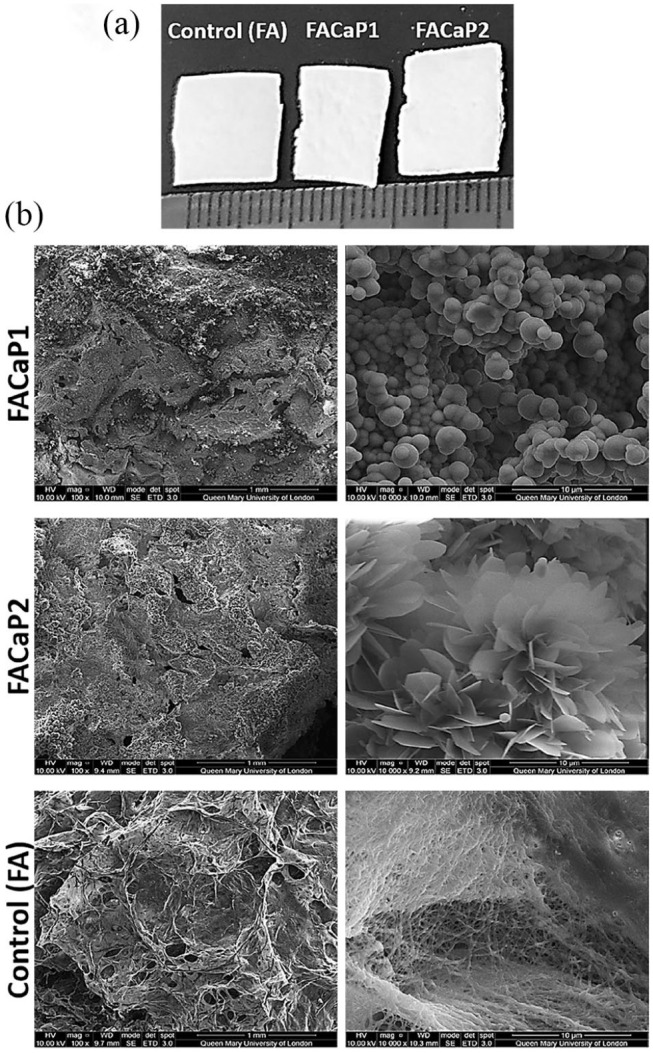
Figure 1.

(a) Macroscopic appearance of scaffolds cut to approximately 1 × 1 cm pieces. Scale is in mm. (b) SEM representative images of control (FA) and FACaP scaffolds. Low magnification (100×) images on the left show the porous structure of the scaffolds. High magnification (10,000×) images on the right show the morphology of the mineral coatings on both FACaP1 and FACaP2 scaffolds. Control scaffolds showed no mineral deposition.
