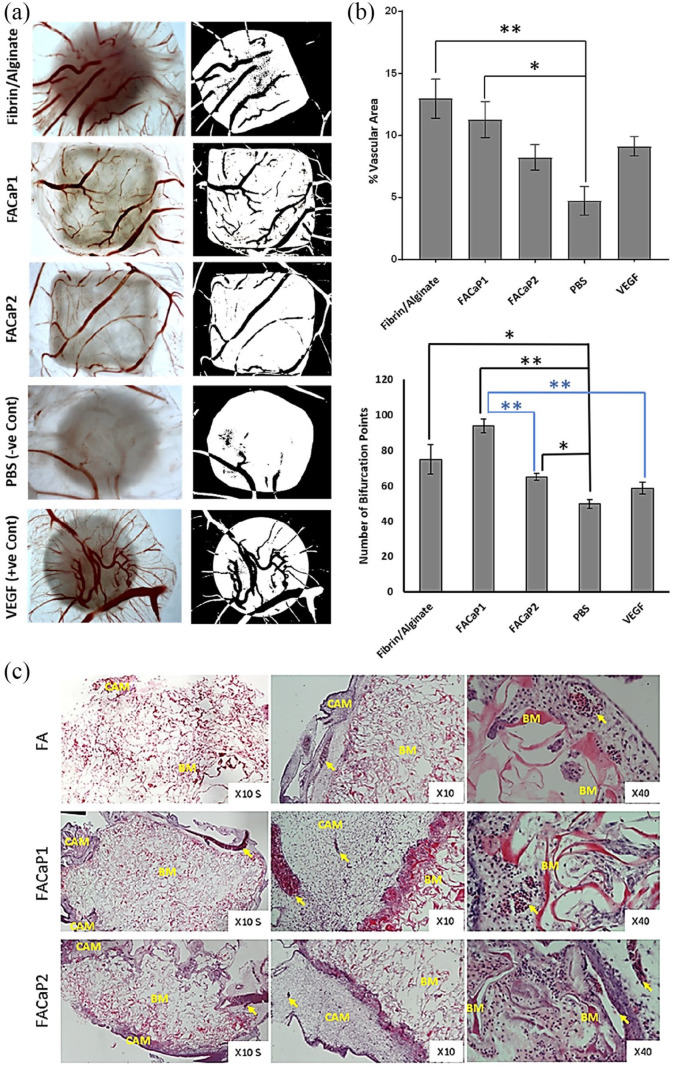
Figure 11.
(a) Representative macroscopic (left) and binary images (right) of the different scaffolds and controls. Blood vessels are seen in red colour (left panel) and black colour over white background of the scaffold (right panel). Please note that the image for C-was already published in Kohli et al.23 (b) Percentage vascular area and bifurcation points of blood vessels within the scaffolds. Data are presented as mean ± SEM of n = 6 for each condition (except for the number of bifurcation points for FA and FACaP1 groups where n = 5). *p < 0.05. **p < 0.01. (c) Representative H&E stained images of FACaP and control scaffolds. Yellow arrows point at individual blood vessels. BM refers to the biomaterial and CAM refers to the surrounding CAM.

