Figure 3.

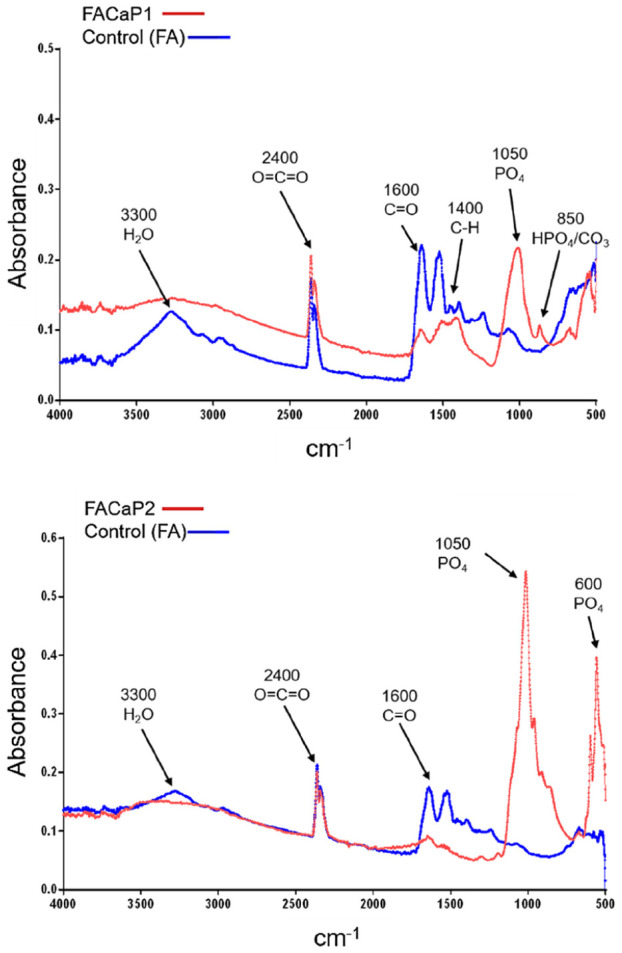
Representative FTIR spectra of scaffolds showing differences between control and FACaP scaffolds with PO4 and CO3 peaks seen in FACaP scaffolds only. A higher intensity peak for PO4 was seen in FACaP 2 compared to FACaP 1.

Representative FTIR spectra of scaffolds showing differences between control and FACaP scaffolds with PO4 and CO3 peaks seen in FACaP scaffolds only. A higher intensity peak for PO4 was seen in FACaP 2 compared to FACaP 1.