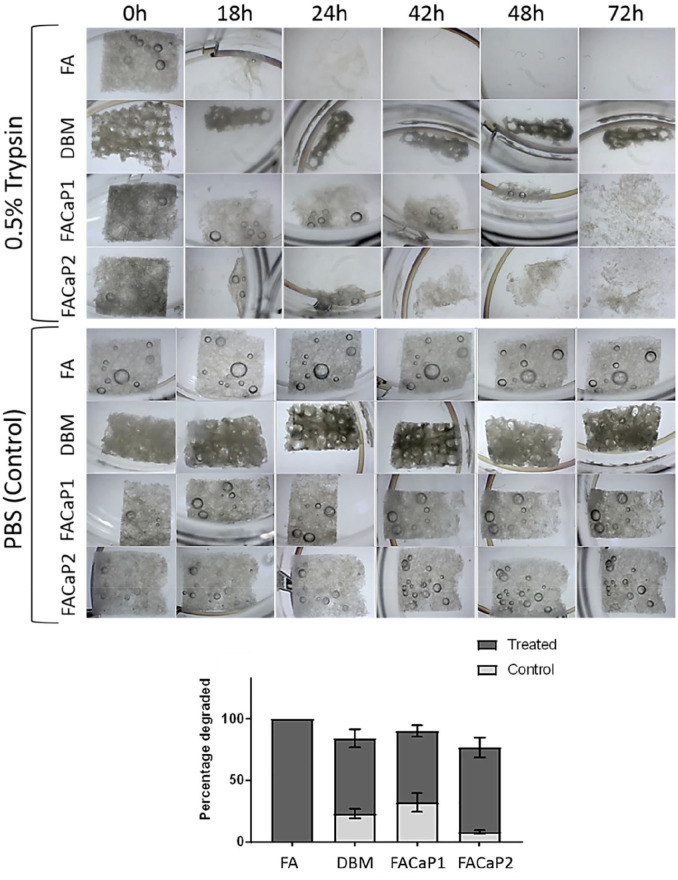
Figure 6.
Representative images showing the degradation of scaffolds (5 × 5 mm) in trypsin-treated (top panels) versus control (bottom panels). FA scaffold was completely degraded after 72 h whereas FACaP and DBM scaffolds did not degrade completely. Superimposed histograms display the percentage of each scaffold that was degraded in treated and control conditions (mean ± SEM of n = 3 for each condition).

