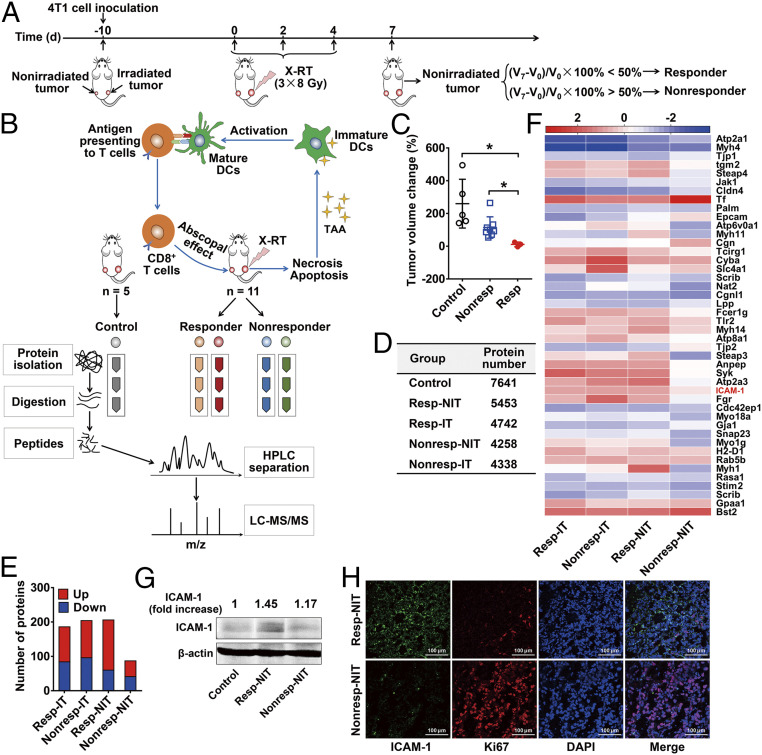
Fig. 1.
Identification and validation of ICAM-1 as a biomarker in responsive nonirradiated tumors after RT. (A) Schedule of X-RT in 4T1 bilateral tumor-bearing mice and the definitions of responder and nonresponder mice. (B) Schematic view of proteomic analysis. (C) Grouped scatterplot presenting the change in tumor volume among nonirradiated tumors on day 7 (nonirradiated control tumors, n = 5; nonresponder tumors, n = 8; responder tumors, n = 3). Data are presented as mean ± SD. *P < 0.05, unpaired Student t test. (D) Identified protein numbers in the nonirradiated tumors of the responder group (resp-NIT), nonirradiated tumors of the nonresponder group (nonresp-NIT), irradiated tumors of the responder group (resp-IT), and irradiated tumors of the nonresponder group (nonresp-IT) by proteomic analysis. (E) Numbers of differently expressed proteins in each group. Red represents up-regulated expression, and blue represents down-regulated expression. (F) Heatmap of log2 fold change (normalized to control tumor) of 44 differentially expressed membrane proteins on day 7 in indicated groups. Data represent group mean, n = 3 per group. (Scale bars: white, 0; red, >2 log2 fold change; blue, <2 log2 fold change.) (G) Western blot analysis of ICAM-1 expression in 4T1 tumor tissues on day 7. The densities of Western blot bands were quantified by scanning densitometry with ImageJ software and are presented as the normalized fold change. (H) Immunofluorescence staining of ICAM-1 and Ki67 in 4T1 tumor tissues derived from resp-NIT or nonresp-NIT.

