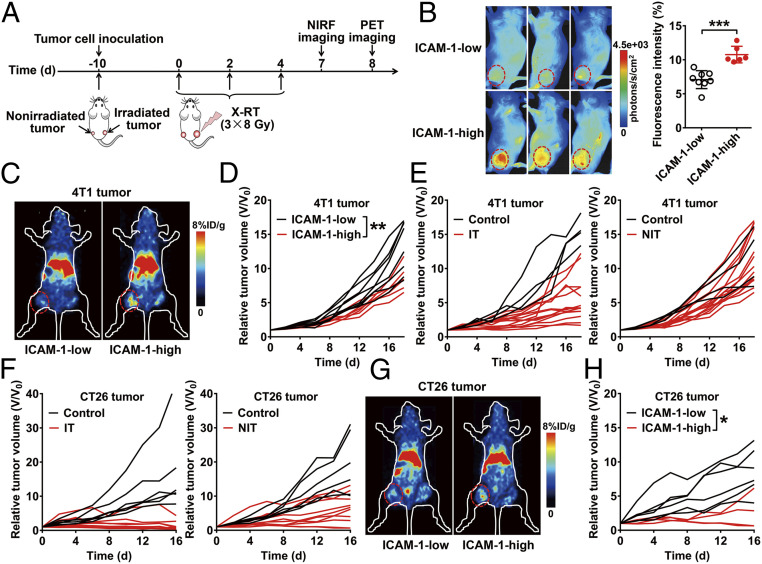
Fig. 2.
Noninvasive imaging of ICAM-1 expression predicts the abscopal response to tumor RT. (A) Schedule of X-RT and in vivo imaging using Dye-αICAM-1/Fab or 64Cu-NOTA-αICAM-1/Fab in the 4T1 or CT26 bilateral tumor-bearing mouse models. (B) Representative in vivo NIRF images and quantitative analysis of tumor uptake of Dye-αICAM-1/Fab at 6 hpi in 4T1 tumor-bearing mice. High or low expression of ICAM-1 was differentiated by quantitative fluorescence intensity (n = 6 to 8 per group). Data are presented as mean ± SD. ***P < 0.001, unpaired Student t test. (C) Representative small animal PET images of 64Cu-NOTA-αICAM-1/Fab at 6 hpi in 4T1 tumor-bearing mice. (D) Growth curves of nonirradiated tumors in 4T1 tumor-bearing mice grouped (ICAM-1 high vs. ICAM-1 low) by quantitative fluorescence intensity in B. (E) Individual growth curves of the irradiated tumors (IT) and nonirradiated tumors (NIT) in the 4T1 tumor model after RT (control group, n = 4; RT group, n = 14). (F) Individual growth curves of the ITs and NITs in the CT26 tumor model after RT (control group, n = 6; RT group, n = 10). (G) Representative small animal PET images of 64Cu-NOTA-αICAM-1/Fab at 6 hpi in CT26 tumor-bearing mice. (H) Growth curves of nonirradiated tumors in CT26 tumor-bearing mice grouped (ICAM-1 high vs. ICAM-1 low) by quantitative fluorescence intensity in SI Appendix, Fig. S13. Tumors are indicated by red circles. *P < 0.05, **P < 0.01, two-way ANOVA (D and H).

