Fig. 3.
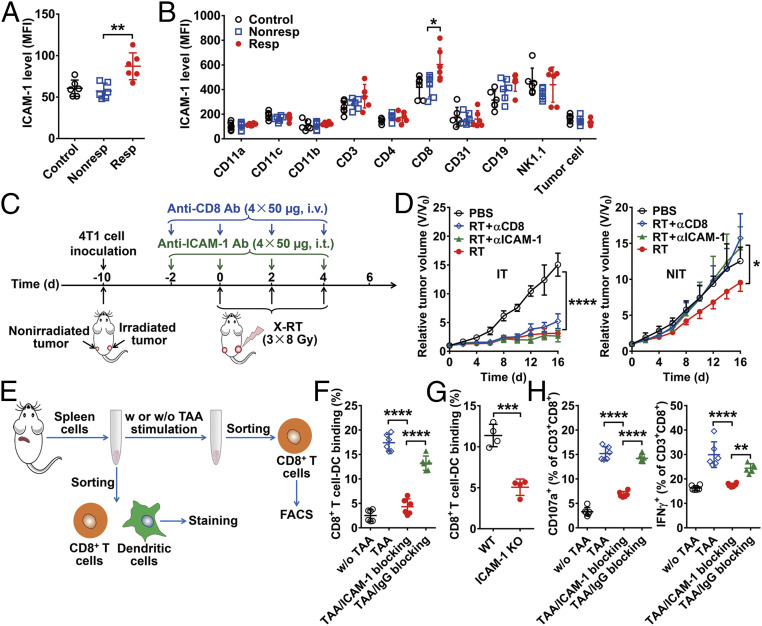
Expression and functional analysis of ICAM-1. (A) Expression level of membrane ICAM-1 measured by flow cytometry in nonirradiated tumors (n = 6 per group). (B) Assessment of ICAM-1 expression in various cell subsets in nonirradiated tumors. Tumor cells were gated by a CD45− subset and forward scatter. (C) Schematic illustration of X-RT in combination with anti–ICAM-1 blocking or anti-CD8 blocking. (D) Tumor growth curves of irradiated tumors (IT) and nonirradiated tumors (NIT) in 4T1 tumor-bearing mice after the indicated treatments: control (PBS), RT, RT plus anti–ICAM-1 blocking (RT + αICAM-1), and RT plus anti-CD8 blocking (RT + αCD8) (n = 5 per group). (E) Schematic diagram of TAA stimulation and immune synapse formation experiments. (F) Flow cytometry analysis of mutual binding between CD8+ T cells and dendritic cells with or without ICAM-1 blocking (n = 6 per group). (G) Flow cytometry analysis of mutual binding between wild-type or ICAM-1 knockout mouse-derived CD8+ T cells and dendritic cells (n = 4 per group). (H) Flow cytometry analysis of CD107a/IFNγ expression on CD8+ T cells with or without blocking with an anti–ICAM-1 antibody (n = 6 per group). All the numerical data are presented as mean ± SD. *P < 0.05; **P < 0.01; ***P < 0.001; ****P < 0.0001 by one-way ANOVA with Tukey’s post hoc test (A, B, F, and H), two-way ANOVA (D), or an unpaired Student t test (G).

