Fig. 4.
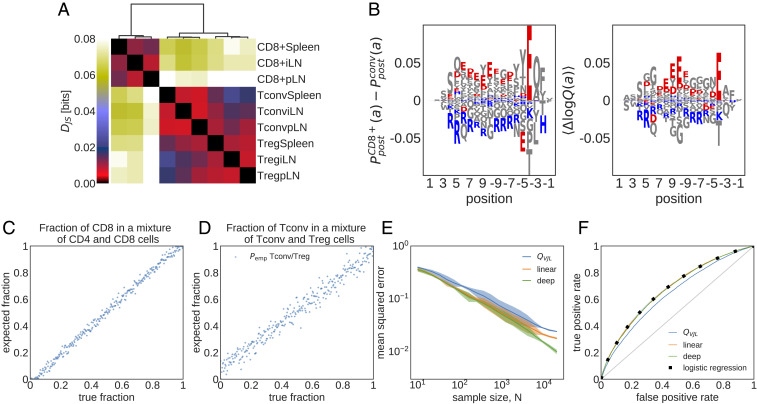
Cell type- and tissue-specific selection on TCRs. (A) Jensen–Shannon divergences () (Eq. 8) computed from models trained on different subrepertoires are shown. (B) Difference in the marginal probability for amino acid composition along the CDR3, , between CD8+ and CD4+ Tconv (Left) and the mean difference in the corresponding log-selection factors for amino acid usage (Right) are shown (the mean is taken over the distribution ). The negatively charged amino acids (Aspartate, D, and Glutamate, E) and the positively charged amino acids (Lysine, K, and Arginine, R) are indicated in red and blue, respectively. Other amino acids are shown in gray. (C) Maximum likelihood inference of the fraction of CD8+ TCRs in mixed repertoires of conventional CD4+ T cells (Tconvs) and CD8+ cells from spleen (Eq. 4) is shown. Each repertoire comprises unique TCRs. (D) Same as C but for a mixture of Tconv and Treg TCRs. (E) Mean squared error of the inferred sample fraction from C as a function of sample size , averaged over all fractions, using models of increasing complexity: “” is a linear model with only features for CDR3 length and VJ usage, “linear” is linear SONIA model, and “deep” is the full soNNia model (Fig. 1C). (F) ROC for classifying individual sequences coming from CD8+ cells or from CD4+ Tconvs from spleen, using the log-likelihood ratios. Curves are generated by varying the threshold in Eq. 5. The accuracy of the classifier is compared with a traditional logistic classifier inferred on the same set of features as our selection models. The training set for the logistic classifier has Tconv CD4+ and CD8+ TCRs, and the test set has CD4+ and CD8+ TCR sequences.

