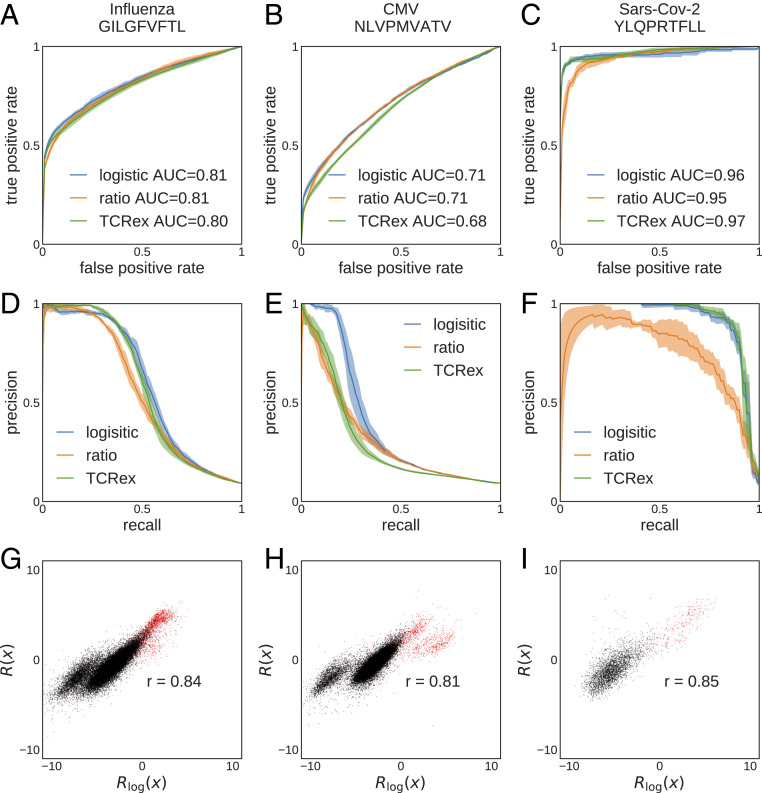
Fig. 5.
Selection-based prediction of epitope specificity for TCR. TCRs are classified based on their reactivity to three pathogenic epitopes (columns), using three classification methods: TCRex, log-likelihood ratio (Eq. 5), and linear logistic regression (Eq. 6). (A–C) ROC curves and (D–F) precision-recall curves for (A and D) influenza epitope GILGFVFTL ( TCR), (B and E) CMV epitope NLVPMVATV (), and (C and F) SARS-CoV-2 epitope YLQPRTFLL () are shown. (G–I) Comparison between log-likelihood scores and logistic regression scores for the three epitopes. Red points are TCRs that bind the specific epitope (positive set), and black points are TCRs from bulk sequencing (negative set). is Pearson’s correlation. For all panels, we used pooled data from ref. 43 as the negative set. We used 10 times more negative data than positive data for training. Performance was quantified using fivefold cross-validation.

