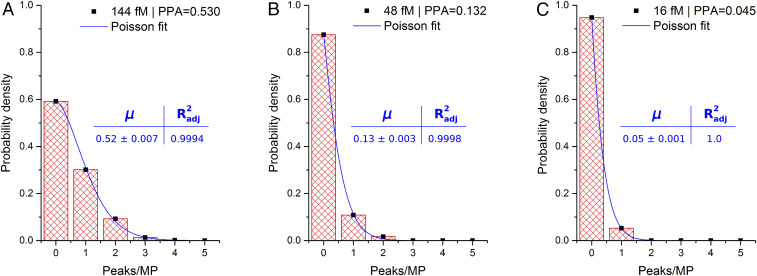
Fig. 3.
Poisson distributions of peaks per microparticle in model assay. The readout of HDIA is always ratiometric (signal/area), but defining an area equivalent to a single microparticle allows the data to be fit to Poisson distributions. The histograms show detected peaks per microparticle for three SAPE concentrations: (A) 144 fM, (B) 48 fM, and (C) 16 fM. The fits show excellent agreement, signifying discrete signals (i.e., single antibody sandwich detection). n = 216.

