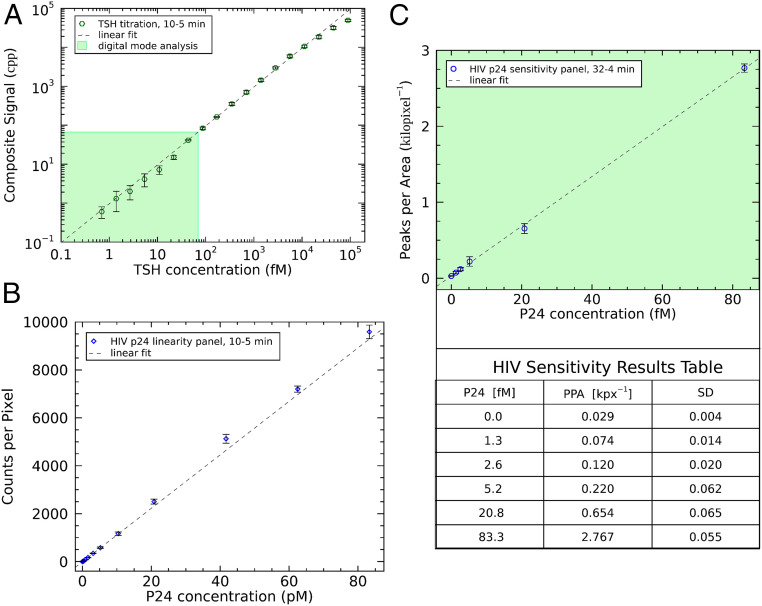
Fig. 5.
HDIA in diagnostic applications. (A) High-concentration recombinant TSH samples were diluted in buffer matrix and incubated for 10 min with microparticles, 5 min with DBB-Fab, and 5 min with 1:1 SAPE. The results are plotted on a log–log scale, accompanied by a linear fit (n = 3). (B) An HDIA HIV assay (10 min with microparticles and DBB; 5 min with SAPE) was performed using a high concentration HIV sample and subsequent dilutions in negative human plasma. The data were analyzed in HDIA analog mode and plotted against a linear fit (n = 4). (C) A longer assay format (32 min with microparticles and DBB; 4 min with SAPE) was used to probe HDIA sensitivity in human plasma. The digitally analyzed results are plotted with a linear fit, and the associated data table shows that the assay is sensitive down to ∼1 fM (n = 3). Error bars: mean ± SD.

