Fig. 2.
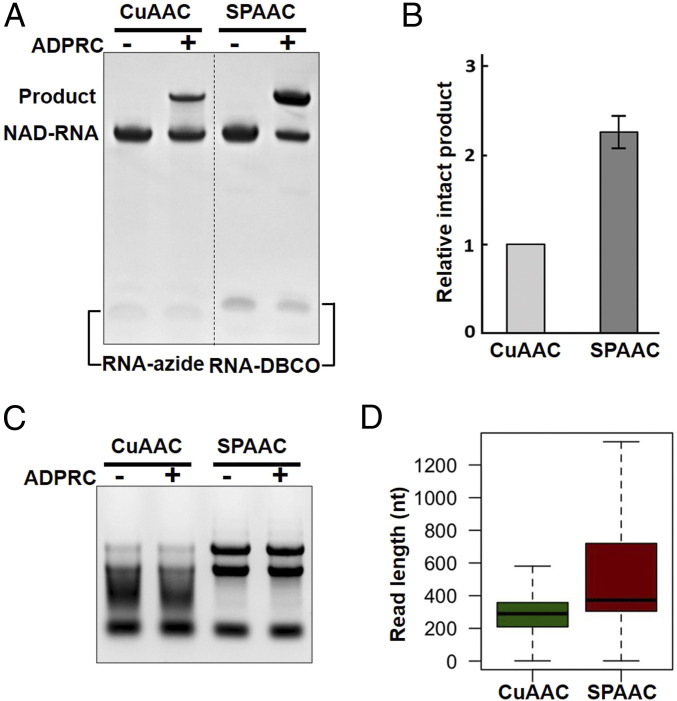
Ligation of NAD-RNAs with RNA tags through CuAAC tagging and SPAAC tagging. (A) Comparison of CuAAC and SPAAC tagging of a synthetic NAD-RNA. For CuAAC tagging, a 50-nt NAD-RNA was reacted with 4-pentyn-1-ol in the presence of ADPRC and then with a 16-nt RNA-azide. For SPAAC tagging, an equal amount of the NAD-RNA was reacted with 3-azido-1-propanol in the presence of ADPRC and then with a 16-nt RNA-DBCO. The amount of the 16-nt RNA-azide used in CuAAC was equal to that of the 16-nt RNA-DBCO used in SPAAC. Parallel experiments without ADPRC served as controls. The RNAs were resolved on a 15% denaturing polyacrylamide gel. (B) Comparison of the amount of ligation products that remained intact from the two different tagging methods. The intensity of the bands representing intact ligation products in A was quantified using ImageJ (https://imagej.nih.gov/ij/). Data were presented as intensity of the band from the SPAAC-based ligation relative to that of the CuAAC-based method from three independent experiments. (C) A representative agarose gel image of E. coli total RNA samples after being subjected to CuAAC and SPAAC tagging. RNAs became highly degraded/fragmented after CuAAC tagging. (D) Comparison of length of the sequencing reads obtained from NAD tagSeq (CuAAC tagging, green) and NAD tagSeq II (SPAAC tagging, purple) of E. coli RNA samples. Read length is shown as the number of nucleotides (nt) with the first quartile, median, and third quartile as the lower, middle, and upper lines of the boxes, respectively.

