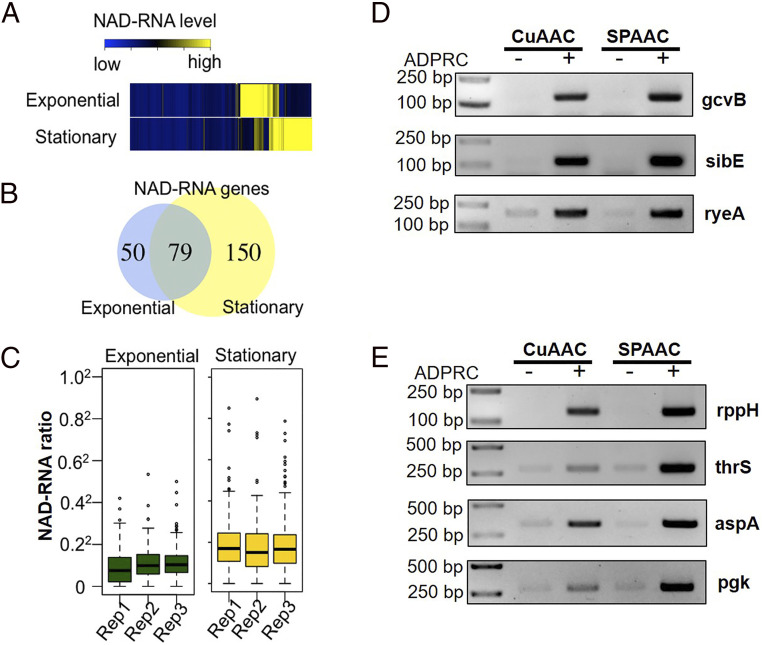
Fig. 4.
Profiles of NAD-RNAs in E. coli in the exponential and stationary phases. (A) Heatmap of normalized NAD-RNA levels in the ADPRC+ samples of stationary and exponential phases, with different colors indicating NAD-RNA levels (blue→yellow; low→high). (B) The numbers of genes producing high-confidence NAD-RNAs identified from the exponential and/or stationary phase cells. (C) Ratios of NAD-RNA reads over the total transcript reads (in square root transformation) from the high-confidence NAD-RNA–producing genes in the exponential phase (Left) and stationary (Right) phase, respectively. (D and E) Verification of NAD-RNAs by NAD capturing. RNA samples were tagged with biotin through CuAAC and SPAAC tagging. Tagged RNAs were captured by Streptavidin beads and subjected to RT-PCR analysis. Three noncoding RNAs (D) and four mRNAs (E) were selected in the analysis. For the negative control, the samples were subjected to the same treatment but without ADPRC.

