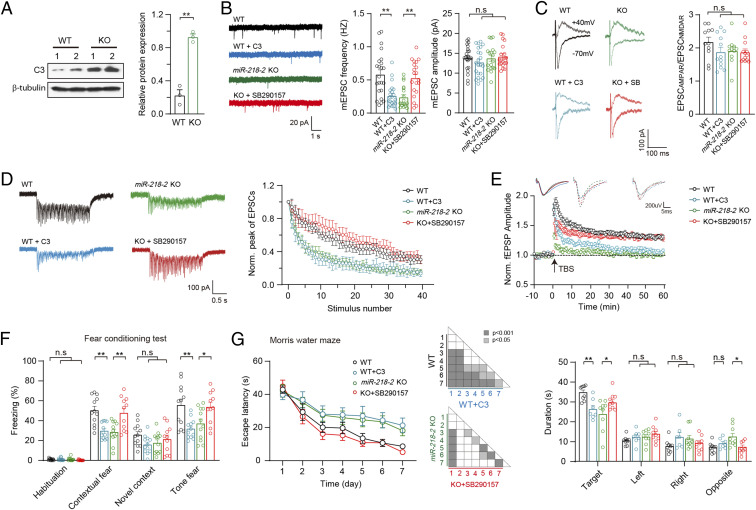
Fig. 6.
C3 is a target gene of miR-218 to regulate presynaptic functions and learning behaviors in mice. (A) Immunoblots (Left) and quantification (Right) of C3 in WT and miR-218-2 KO neurons. n = 3. (B) Sample traces (Left), frequency (Middle), and amplitude (Right) of mEPSCs recorded in hippocampal slices of WT mice treated with C3 peptide, or miR-218-2 KO slices treated with SB290157. WT, n = 23; WT + C3, n = 22; miR-218-2 KO, n = 19; KO + SB290157, n = 20. (C) Sample traces (Left) and ratio (Right) of EPSCAMPAR/EPSCNMDAR recorded in acute slices. WT, n = 11; WT + C3, n = 12; miR-218-2 KO, n = 11; KO + SB290157, n = 13. (D) Train-stimulation–evoked EPSCs. WT, n = 12; WT + C3, n = 15; miR-218-2 KO, n = 13; KO + SB290157, n = 14. (E) Sample traces of fEPSPs (Upper) and time course of the fEPSPs amplitude (Lower) before and after LTP induction. WT, n = 14; WT + C3, n = 24; miR-218-2 KO, n = 19; KO + SB290157, n = 31. (F) Percentage of freezing ratio in the FC test. WT, n = 12; C3, n = 12; miR-218-2 KO, n = 12; KO + SB290157, n = 11. (G) Analysis of MWM test. Average time spent to locate the submerged escape platform during the 7 d training session (Left); ANOVA. Average time spent in the four quadrant areas when the platform was absent (Right). WT, n = 9; C3, n = 7; miR-218-2 KO, n = 9; KO + SB290157, n = 9. Student’s t test. *P < 0.05; **P < 0.001; error bars, SEM.

