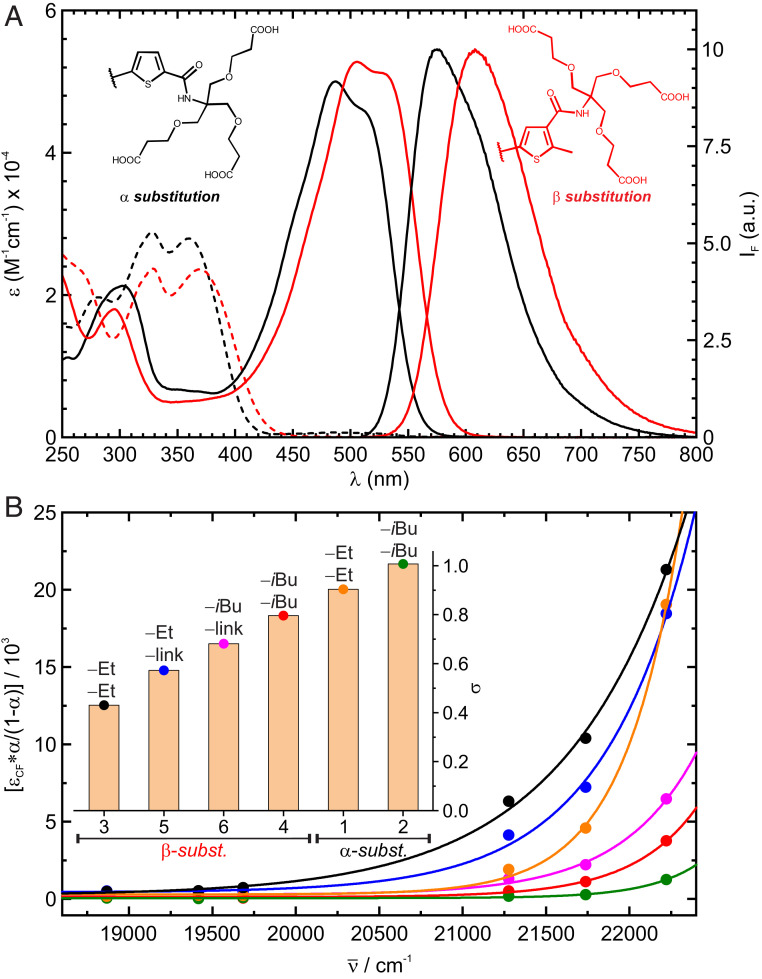
Fig. 1.
(A) Absorption spectra of fDAE1 (black) and fDAE4 (red) in OF (dashed lines) and CF (solid lines), as well as substitution pattern of compounds and emission of the CF in acetonitrile. (B) Conversion (α/1-α) through Urbach tail excitation of the OFs with the corresponding fit according to Eq. 4. (Inset) Calculated steepness parameters (σ); the substituents at the central positions (as in Scheme 1 and Fig. 1) are indicated.

