Fig. 2.
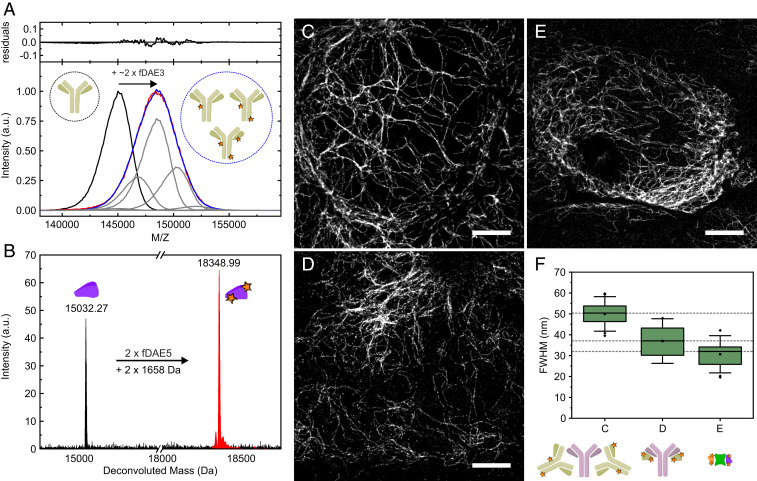
Mass analysis and imaging applications of antibodies and nanobodies labeled with fDAEs. (A) Matrix-assisted laser desorption ionization mass spectrometry analysis of a polyclonal secondary antibody labeled with fDAE3. (Lower) The spectra of the unlabeled antibody (black) and the labeled one (red) are shown along with a fit (blue) to a distribution of the shifted curves (representing the addition of dye molecules) with various amplitudes (gray). (Upper) The residuals of the fit. (B) Electrospray ionization mass spectrometry of an anti-GFP nanobody (NBg2a) containing two cysteine residues. The spectra of the unlabeled nanobody (black) and the labeled one (red) are presented, and the molecular mass of the dye (fDAE5) is indicated. (C–E) Superresolution images of U2OS cells expressing rsEGFP2 in vimentin and labeled with a primary and a secondary antibody (C), a primary antibody and a secondary (NBr) nanobody (D), and two anti-GFP nanobodies (NBg2a and NBg2b, 1:1 mixture, in E). The primary antibody used in C and D is the same. (F) (Upper) Average widths of single filaments; each boxplot was calculated from 20 independent measurements. Boxes show the first and third quartiles of data values; the line and the square show the median and the mean values, respectively. Error bars cover the mean value plus and minus 2 times the SD. (Scale bars, 4 μm.) In panels A, B, and F, the schematic representations of the antibodies, nanobodies, GFP, and the fluorescent labels are shown.

