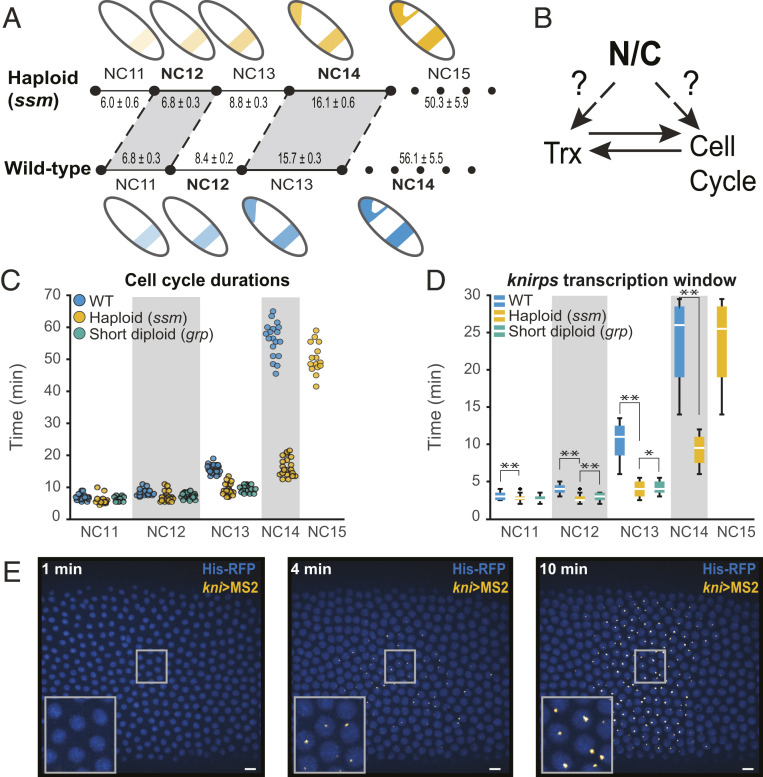
Fig. 1.
The N/C ratio regulates cell cycle and transcription duration. (A) Cell cycle elongation and transcription activation (as illustrated by a cartoon of the kni expression pattern) are both delayed by a reduction of the N/C ratio. Haploid (ssm) embryos undergo one additional fast cell cycle to restore the correct N/C ratio before slowing, and all previous NCs are correspondingly shortened. Transcription is similarly delayed. The mean cell cycle durations ± the SEM are given (in minutes) for both genotypes. (B) Since the N/C ratio affects both cell cycle and transcription, it is difficult to disentangle which event is upstream or if both sense the N/C ratio independently. (C) Scatterplot of cell cycle duration from WT (blue), haploid (yellow), and short-cycle diploid (green) embryos illustrate how ploidy affects the length of interphase and therefore the maximum potential transcriptional window. The number of embryos analyzed in WT, haploid (ssm), and short-cycle diploid (grp) in each NC is as follows: NC11 [26, 20, 18], NC12 [30, 25, 18], NC13 [30, 25, 18], NC14 [24, 26, N/A], and NC15 [N/A, 16, N/A]. (D) Boxplots showing that kni(5′+int)>MS2 transcription duration is longer in WT than haploid and short-cycle diploid embryos. Boxplots show minimum (10%), lower (25%), median, upper (75%), and maximum (90%) quantiles. Outliers are shown as “+.” *P < 0.05 and **P < 0.005 from Student’s t test. 47 NC11, 184 NC12, 658 NC13, and 1051 NC14 nuclei from six replicate kni(5′+int)>MS2 WT embryos; 42 NC11, 121 NC12, 393 NC13, 755 NC14, and 1,218 NC15 nuclei from four replicate kni(5′+int)>MS2 haploid embryos; and 25 NC11, 68 NC12, and 267 NC13 nuclei from four replicate kni(5′+int)>MS2 short-cycle diploid embryos were analyzed. (E) Representative images of MS2-foci in an embryo expressing kni(5′+int)>MS2 reporter (yellow). Nuclei are marked with His2Av-mRFP (shown in blue). Images show kni(5′+int)>MS2 expression at 0, 4, and 10 min after the onset of NC14. The insets are magnifications of the embryo within the rectangle. Pixel histogram was adjusted for visualization purposes only, and images were rotated to orient the embryo (left-anterior, right-posterior).

