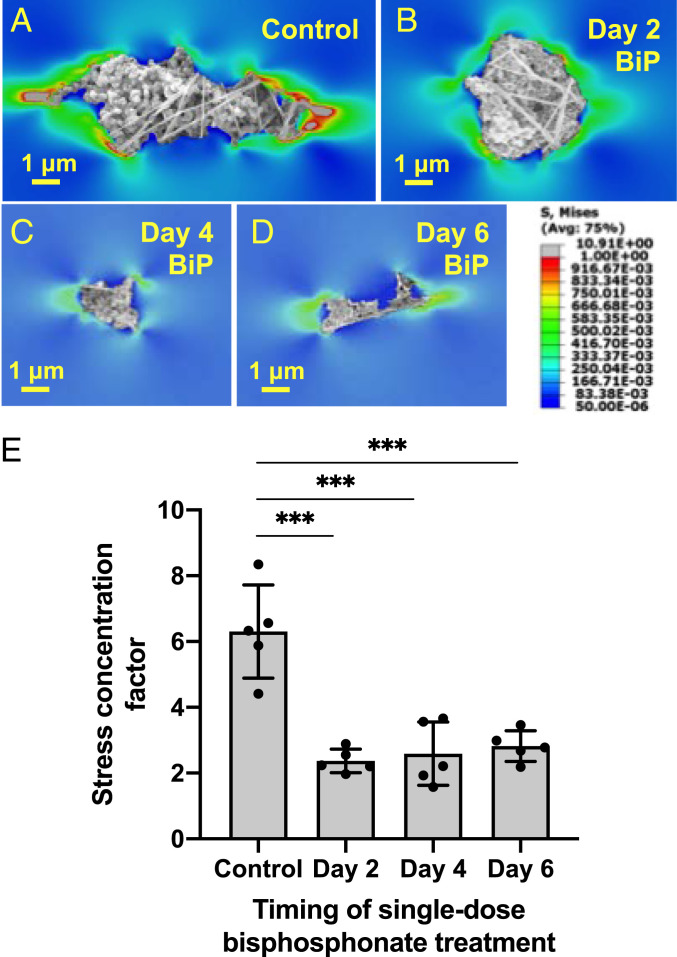
Fig. 7.
BiP treatment altered the predicted fibrous cap tensile stress attributed to single microcalcifications, in a time-dependent manner. A–D demonstrate FEA analysis of representative microcalcifications treated with BiP at different time points. E quantifies the average stress concentration factor for five representative microcalcifications from each BiP-treated group, as compared to untreated microcalcifications (control), (n = 3 biological replicates per group, except day 6 group, which reflects n = 2 biological replicates, error bars represent SD, ***P < 0.0001).

