Fig. 2.
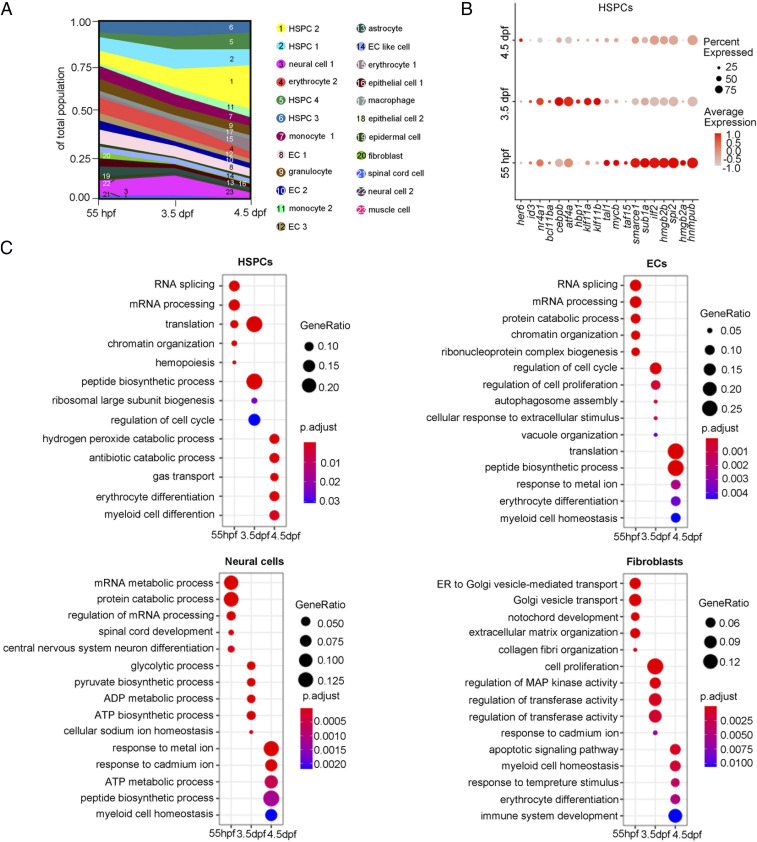
Cell composition and gene-expression dynamics during CHT development. (A) Fraction of cell clusters per developmental stage, displaying a dynamic change in cell-type complexity throughout our sampling. (B) Dot plot showing the differentially expressed TFs within the HSPCs at each development stage. (C) Dot plots showing the differentially enriched GO terms within HSPCs, ECs, neural cells, and fibroblasts at each developmental stage.

