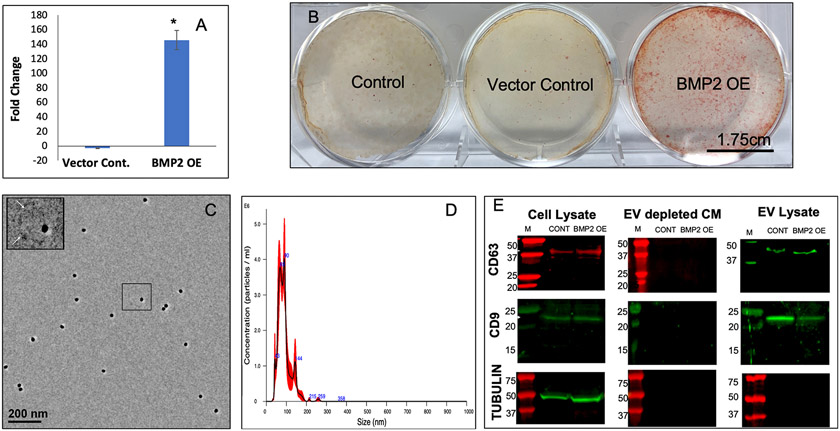
Figure 1: Generation, isolation and characterization of BMP2 FEEs:
A) Graph representing the fold change in the expression levels of BMP2 gene in vector control and BMP2 OE HMSCs with respect to untreated controls. Data represent mean foldchange +/− SD of three independent cultures. B) Representative images of alizarin red stained culture dishes of control, vector control and BMP2 OE HMSCs after 7 days of culture in osteogenic differentiation media. Scale bar represents 1.75cm. Note the increase in calcium deposits in the BMP2 OE HMSC group. C) Representative TEM image of BMP2 FEEs immunolabeled for CD63 (20nm gold dots). The insert represents the boxed area. The arrows in the insert represent the EV membrane. D) Representative NTA plot of BMP2 FEEs indicating exosomal size distribution. E) Immunoblots of Cell lysates, EV depleted conditioned medium and EV lysates from control and BMP2 OE HMSCs for the presence of CD63 and CD9 exosomal marker proteins as well as for the intracellular protein control tubulin. Note the absence of the EV markers and tubulin in the EV depleted conditioned medium and the absence of tubulin in the EV lysates.

