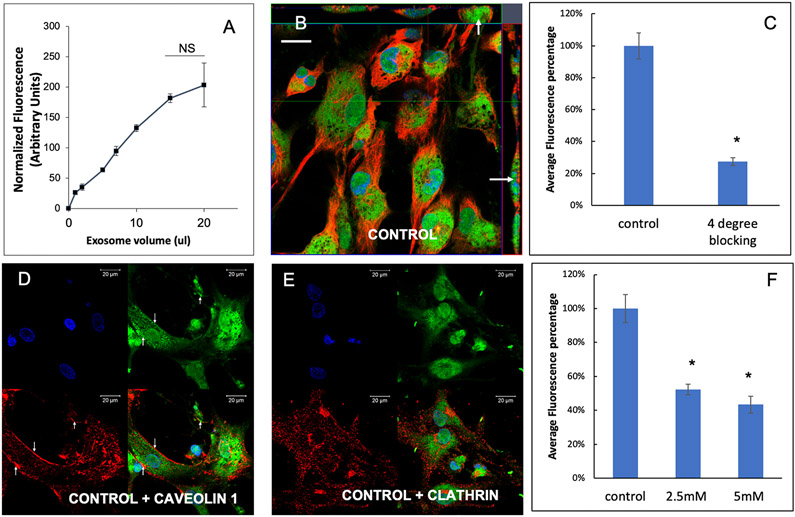
Figure 2: Endocytosis of BMP2 FEEs by HMSCs:
A) Graphical representation of dose-dependent and saturable endocytosis of fluorescently labeled BMP2 FEEs by naïve HMSCs. Data points represent mean fluorescence +/− SD (n=6). All data points were statistically significant as measured by Tukey’s ad-hoc test post ANOVA with respect to the untreated control and with respect to adjacent data points except as indicated between the last two points. B) Representative confocal micrograph showing orthogonal view of a z-stack of confocal images of BMP2 FEE endocytosis by naïve HMSCs at 37°C. The arrows point to localization of the fluorescently labeled FEEs within the cells. Scale bar represents 20μm. C) Graph showing the reduction in BMP2 FEE endocytosis at 4°C compared to 37°C (data represent mean percentage fluorescence +/−SD, n=6). * represents statistical significance with respect to control as measured by student’s t-test. D) Confocal micrograph showing colocalization of endocytosed BMP2 FEEs (green) with caveolin1 (red). E) Confocal micrograph showing the absence of co-localization between endocytosed BMP2 FEEs (green) and clathrin (red). In images D and E, scale bar represents 20μm. F) Graph showing the reduction in HMSC endocytosis after disruption of target cell membrane cholesterol with increasing doses of MBCD. Data is presented as mean percentage fluorescence with respect to control +/− SD (n=6). * represents statistical significance with respect to control as measured by Tukey’s ad-hoc test post ANOVA.

