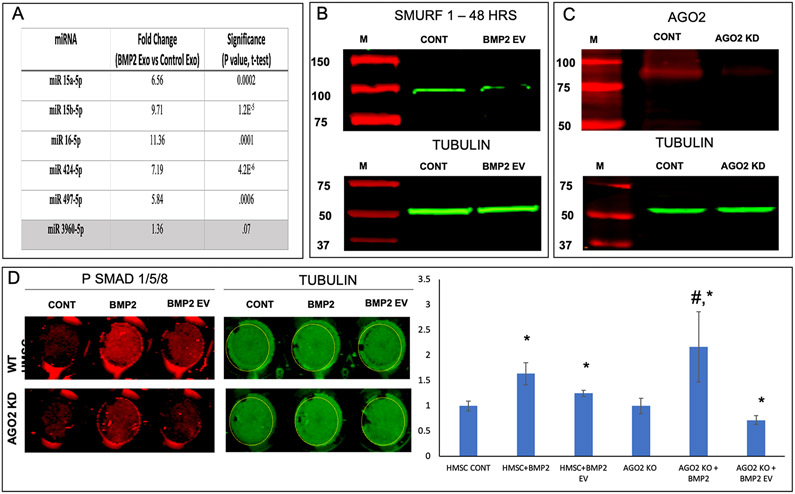
Figure 4: Role of BMP2 FEE miRNAs:
A) Table listing the mean fold change (n=4) in the expression levels of miRNA that bind to the 3’UTR of SMAD7 and SMURF1. miRNA 3960 is a pro-osteogenic miRNA that remained unchanged and is used as a control to show pathway specific increase in EV miRNA composition. P value was calculated using student’s t-test. B) Immunoblot of SMURF1 in untreated control HMSC cell lysate and BMP2 EV treated cell lysate (top) and the corresponding tubulin blot (loading control, bottom). Note the reduction in the expression of SMURF 1 post treatment with BMP2 EVs. C) Immunoblot confirming the knockdown of AGO2 protein expression in HMSCs (top) and the corresponding tubulin loading control (bottom). D) Representative in-cell western images of wells representing PSMAD 1/5/8 (red) and tubulin (green) expression in control (WT HMSC) and AGO2 knockdown (AGO2 KD) HMSCs treated with rhBMP2 or BMP2 EVs. Note the reduction in the level of PSMAD 1/5/8 in the BMP2 EV treated AGO2 KD group compared to the WT HMSC group. The graph represents the quantitation of the in-cell western results (n=5). *represents statistical significance w.r.t control and # represents statistical significance with respect to untreated AGO2 KD group as measured by Tukey’s ad-hoc pairwise test post ANOVA.

