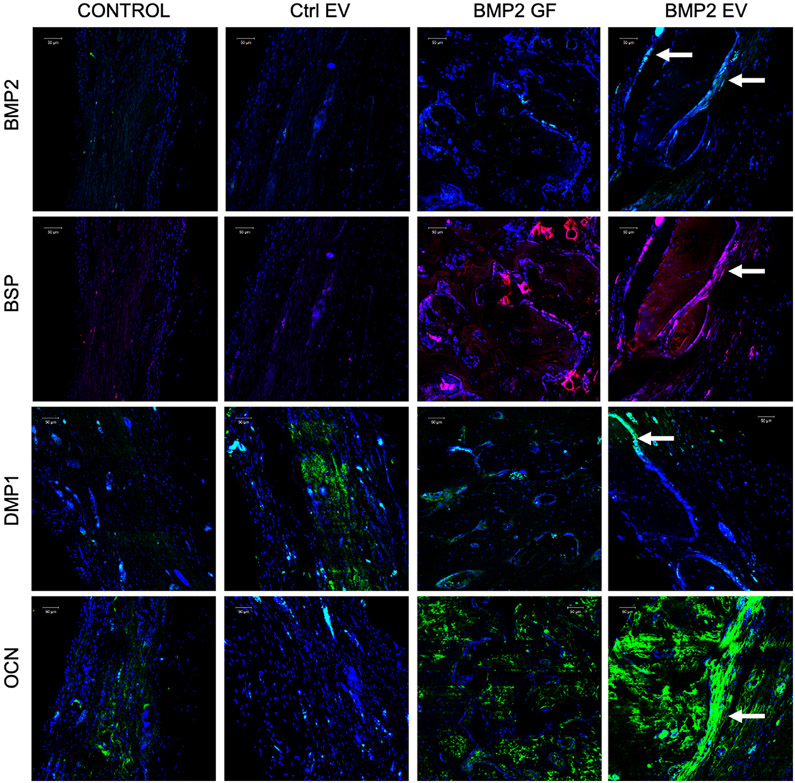
Figure 7: IHC of calvarial defects:
Images represent the expression levels of osteoinductive marker proteins BMP2, BSP, DMP1 and OCN in the calvarial sections from the different groups after 4 weeks. Note the increase in the expression levels of all markers in the rhBMP2 treated (BMP2 GF) and BMP2 EV treated groups. The arrows in the BMP2 EV group shows protein expression in the cells lining the newly formed bone. Scale bar represents 50μm in all images

