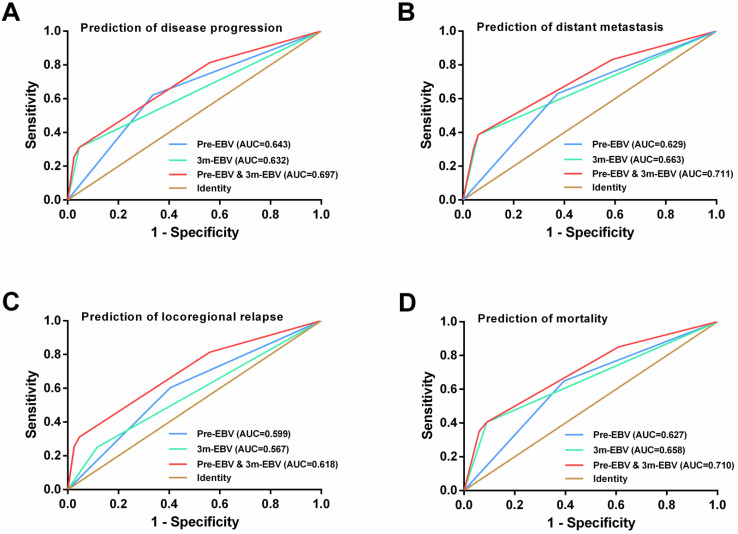
Figure 4.
ROC curve analysis for comparing the prognostic potential of pre-treatment (pre-EBV), 3 months post-treatment (3 m-EBV) plasma EBV DNA levels, and integrated pre-EBV and 3 m-EBV values. (A) Prediction of disease progression. (B) Prediction of distant metastasis. (C) Prediction of locoregional relapse. (D) Prediction of mortality. AUC: the area under the curve.

