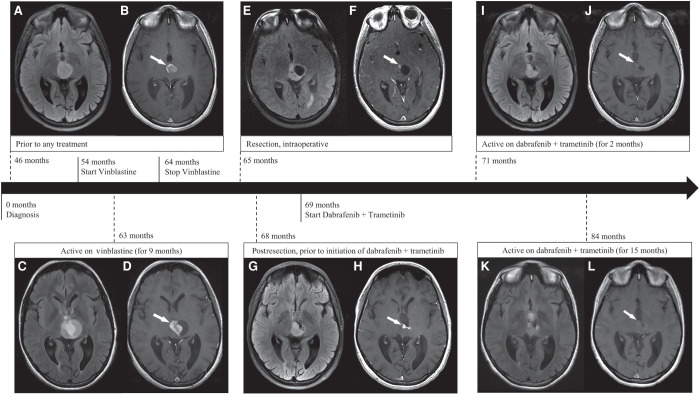
Figure 1.
Radiographic features of the tumor related to type and time of treatment. Prior to vinblastine and dabrafenib/trametinib through 46 mo postdiagnosis: Axial T2-FLAIR image (A) shows a well-circumscribed T2-hyperintense midbrain mass, reported as increased in size; postcontrast axial T1-W image (B) shows intense peripheral rim enhancement (arrow) and central diffuse enhancement. Active on vinblastine (for 9 mo) and prior to dabrafenib/trametinib through 63 mo postdiagnosis: Axial T2-FLAIR image (C) shows increased size of solid and cystic components of the mass; postcontrast axial T1-W image (D) shows increased central area of enhancement (arrow). Intraoperative, postresection, 65 mo postdiagnosis: Axial T2-FLAIR image (E) shows partial resection of solid and cystic components of the mass; postcontrast axial T1-W image (F) shows a residual sub centimeter enhancing focus (arrow). Three months postresection and prior to initiation of dabrafenib/trametinib through 68 mo postdiagnosis: Axial T2-FLAIR image (G) shows increased size of the anterior solid component of the mass; postcontrast axial T1-W image (H) shows two new nodular enhancing foci (arrow). Stopped vinblastine and active on dabrafenib/trametinib (for 2 mo) through 71 mo postdiagnosis: Axial T2-FLAIR image (I) shows decreased size of the mass; postcontrast axial T1-W image (J) shows significantly decreased enhancement (arrow). Stopped vinblastine and active on dabrafenib/trametinib (for 15 mo) through 84 mo postdiagnosis: Axial T2-FLAIR image (K) shows further decrease in size of the mass; postcontrast axial T1-W image (L) shows minimal to no enhancement (arrow).

