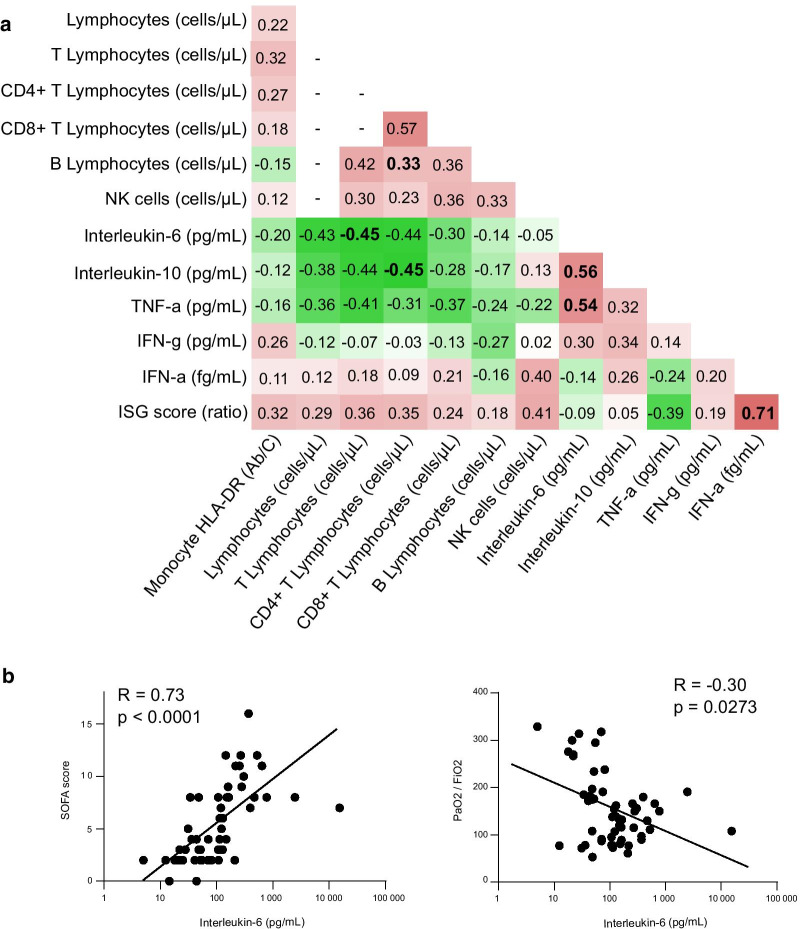
Fig. 1.
Correlation matrix of immune parameters at ICU admission. Immune parameters were measured at inclusion in 64 critically ill patients with COVID-19, and correlations were calculated using Spearman correlation tests. a Results are presented as a correlation matrix. Spearman correlation coefficients are plotted. Cells were colored according to the strength and trend of correlations (shades of red = positive, shades of green = negative correlations). Coefficients with a p value below 0.005 were highlighted in bold and considered significant after correction for multiple testing. Correlation results for non-independent parameters (i.e., lymphocyte subpopulations) are not presented. b Correlations between plasma interleukin-6 concentration at inclusion and sepsis-related organ failure (SOFA) score or PaO2/FiO2 ratio measured during first 24 h after admission are shown (n = 58). Corresponding logarithmic trendlines are shown

