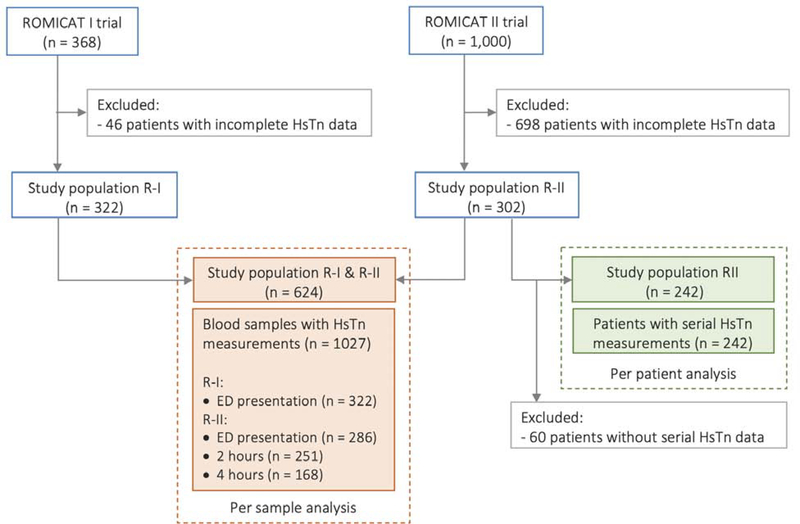
Figure 1. Study Population enrollment, exclusion, and inclusion.
The flow chart summarizes the selection of the patient population included in the per-sample and per-patient analyses. ED=emergency department; Hs-cTn=High-sensitivity cardiac troponin; R-I=ROMICAT-I; R-II=ROMICAT-II; ROMICAT=Rule Out Myocardial Infarction/Ischemia Using Computer-Assisted Tomography II.

