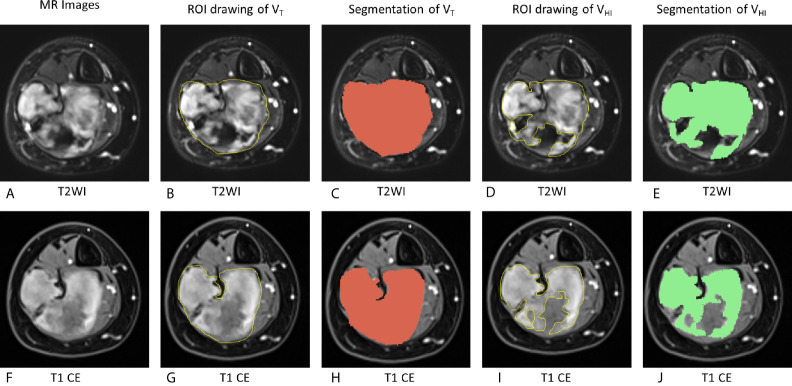
Figure 2.
Schematic of evaluation of MRI hyperintensity of pre-therapy MRI. On T2WI, VT = 162,695 mm3, VHI = 100,871 mm3, HI = 62.0% (grade = 2). On T1 CE, VT = 161,577 mm3, VHI = 103,267 mm3, HI = 63.9% (grade = 2). VT, The tumor volume; VHI, volume of signal hyperintensity; HI, the hyperintensity percentage of the tumor. (A–E), T2WI images. (F–J): T1 CE images. (A, F): MR images without any drawing. (B, G): ROI drawing of the tumor volume (VT). (C, H): Segmentation of VT. (D, I): ROI drawing of the volume of signal hyperintensity (VHI). (E, J): segmentation of VHI.

