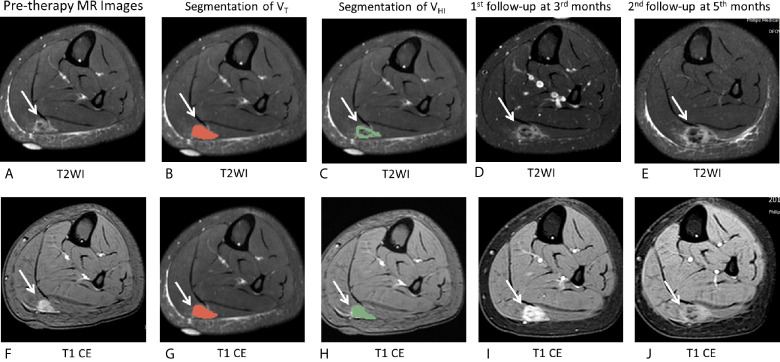
Figure 5.
MR images of the representative case. (A–J), A 16-year-old female patient with DF of right calf muscle with imatinib treatment (arrows). Pre-therapy MR images refer to examination before imatinib treatment. Pre-therapy (A, F) diameter, 20.0 mm; On T2WI, VT = 6,242 mm3, VHI = 6,242 mm3, HI = 100% (grade = 3); On T1 CE, VT = 6,357 mm3, VHI = 6,357 mm3, HI = 100% (grade = 3). Segmentation of VT (B, G, red zone) and segmentation of VHI (C, H, green zone). 1st follow-up at 3 months after imatinib treatment (D, I) Diameter, 23.5 mm indicates a 17.5% increase in tumor size as well as a decrease in T2 and T1 CE signal intensity. The tumor response is SD, according to RECIST1.1. Second follow-up at 6 months since imatinib treatment (E, J) diameter, 48.0 mm shows a 240% increase in tumor size as well as a decrease in T2 and T1 CE signal intensity. The tumor response assessment is PD, according to RECIST1.1. After the second follow-up examination, this patient changed treatment strategy to chemotherapy.

