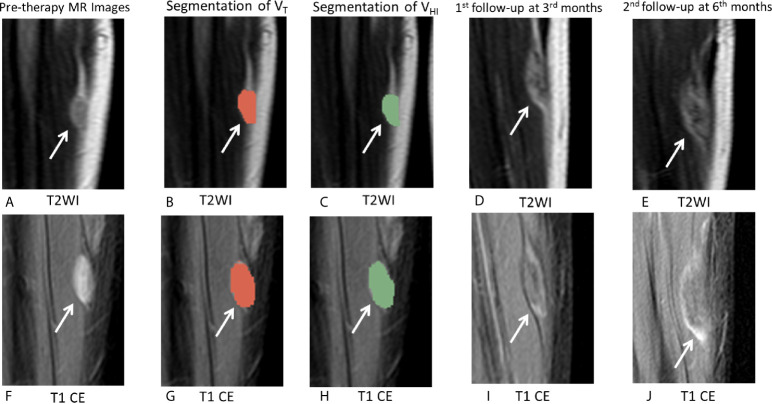
Figure 7.
MRI images in a 18-year-old male patient with DF of left calf muscle with imatinib treatment (arrows). Pre-therapy (A, F) diameter, 21.0 mm; On T2WI, VT = 5,477 mm3, VHI = 418 mm3, HI = 7.5% (grade = 0); On T1 CE, VT = 5,238 mm3, VHI = 5,238 mm3, HI = 100% (grade = 3). Segmentation of VT (B, G, red zonex) and segmentation of VHI (C, H, green zone). First follow-up at 3 months since treatment with imatinib (D, I) diameter, 25.0 mm indicates a 19.0% increase in tumor size. The tumor response assessment is SD, according to RECIST1.1. Second follow-up at 5 months since treatment with imatinib (E, J) diameter, 36.0 mm indicates a 71.4% increase in tumor size. The tumor response assessment is PD, according to RECIST1.1.

