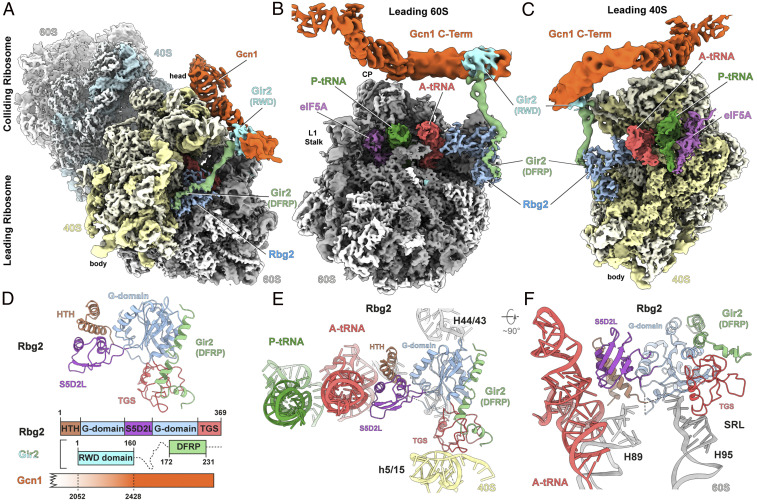
Fig. 2.
Structure of Rbg2-Gir2 on the leading stalled ribosome. (A–C) Cryo-EM reconstruction of the Gcn1-disome complex (A) and interface views of the 60S subunit (B) and 40S subunit (C) of the leading stalled ribosome. Segmented densities for Gcn1 (orange), colliding ribosome (40S, cyan; 60S, gray), the leading ribosome (40S, pale yellow; 60S, gray), P-tRNA (green), A-tRNA (red), Rbg2 (light blue), Gir2-DFRP (green), Gir2-RWD (cyan), and eIF5A (purple). (D) Molecular model for Rbg2-Gir2-DFRP with schematic representation of the Rbg2-Gir2-Gcn1 interactions. Domains are colored as indicated. (E and F) Interactions of Rbg2 colored by domain as in D with 40S (pale yellow) and 60S (gray) components and A-site tRNA (red) and P-site tRNA (green).

