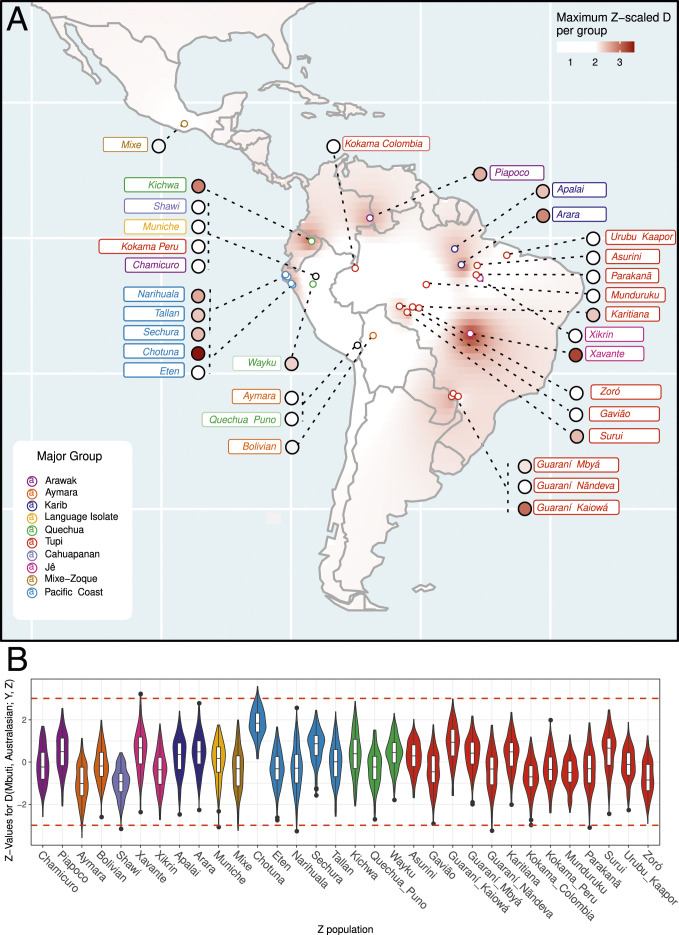
Fig. 1.
Relative patterns of genetic affinity of Australasians among Native American groups. (A) Maximum Z values per population interpolated with the inverse distance weighting method. (B) Distribution of all estimated Z values (y axis) for each “Z” population (x axis) as violin and box plots. In B, the black dots represent outliers, and the red dashed lines indicate the Z-value thresholds of Z = −3 and Z = 3.

