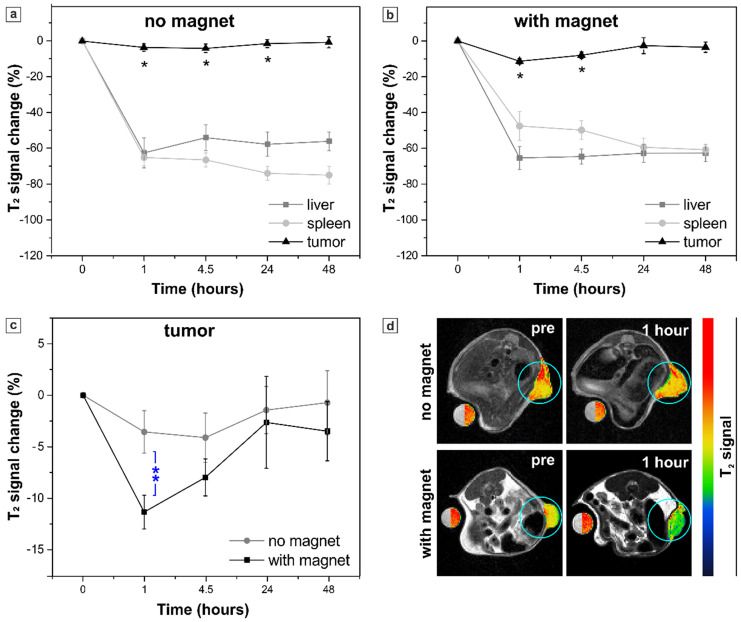
Figure 8.
Sample C6S. Percent of T2 signal change in the organs of interest (tumor, liver and spleen) at different time points resulting from the systemic injection of sample C6S: (a) without and (b) with the application of the external magnet to the tumor, an asterisk (*) indicates significant differences in T2 signal change in tumor in comparison to pre-injection images; (c) comparison of T2 signal change in the mice tumors with and without magnet application, two asterisks (**) indicate significant difference (p < 0.01) between these two groups. The values correspond to the “mean ± SE”, n=4 per each group (no magnet/ with magnet). (d) Representative T2-weighted axial MR images of mice acquired before (pre) and 1 hour after the injection. Tumors are marked with blue circles and presented in pseudo colors; a water-containing reference tube is presented in both, original grayscale and pseudo colors.

