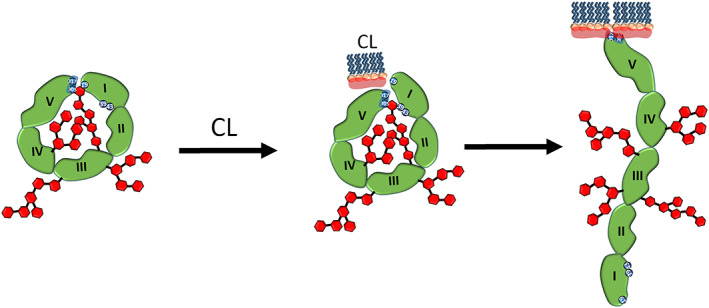
FIGURE 8.

Mechanisms of the conformational changes of β2GPI upon interacting with DOPS and CL shown in schematic view. Blue numbers mark Lys/Arg patches, including Lys19, Arg39, Arg43, Lys305 and Lys317. Red hexagons represent polysaccharides. The head group of DOPS, shown in light red, carries weaker negative charges than CL. The domaina I, II, III, IV and V of β2GPI in green are also marked
