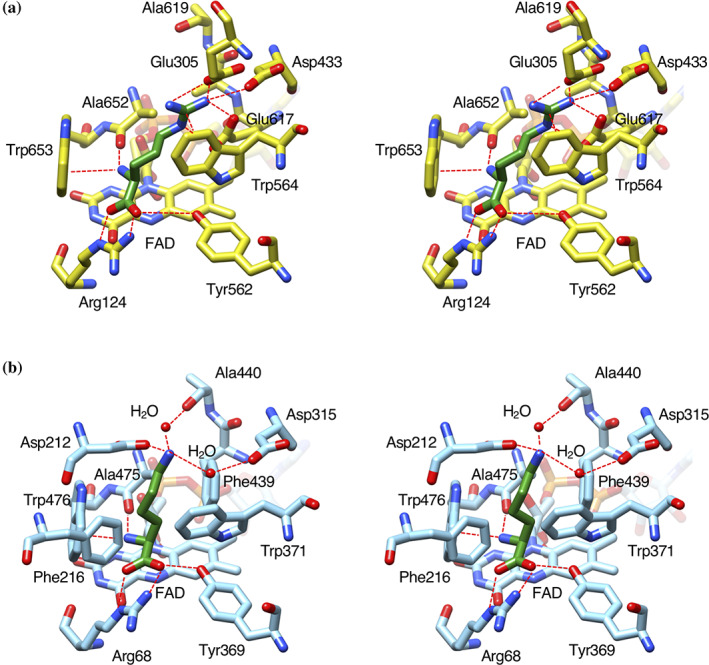
FIGURE 5.

Comparison of the substrate‐binding site structure of LGOX R305E with that of LysOX. Stereo view of the substrate binding structure of LysOX‐Lys (a), and LGOX R305E‐Arg (b). The substrate molecules are colored in green. The protein residues and FAD are shown in yellow for LysOX and cyan for CrLAAO. The nitrogen and oxygen atoms are colored in blue and red, respectively. The bound water molecules are shown as red balls. Possible hydrogen bonds and cation‐π interactions are indicated by red broken lines
