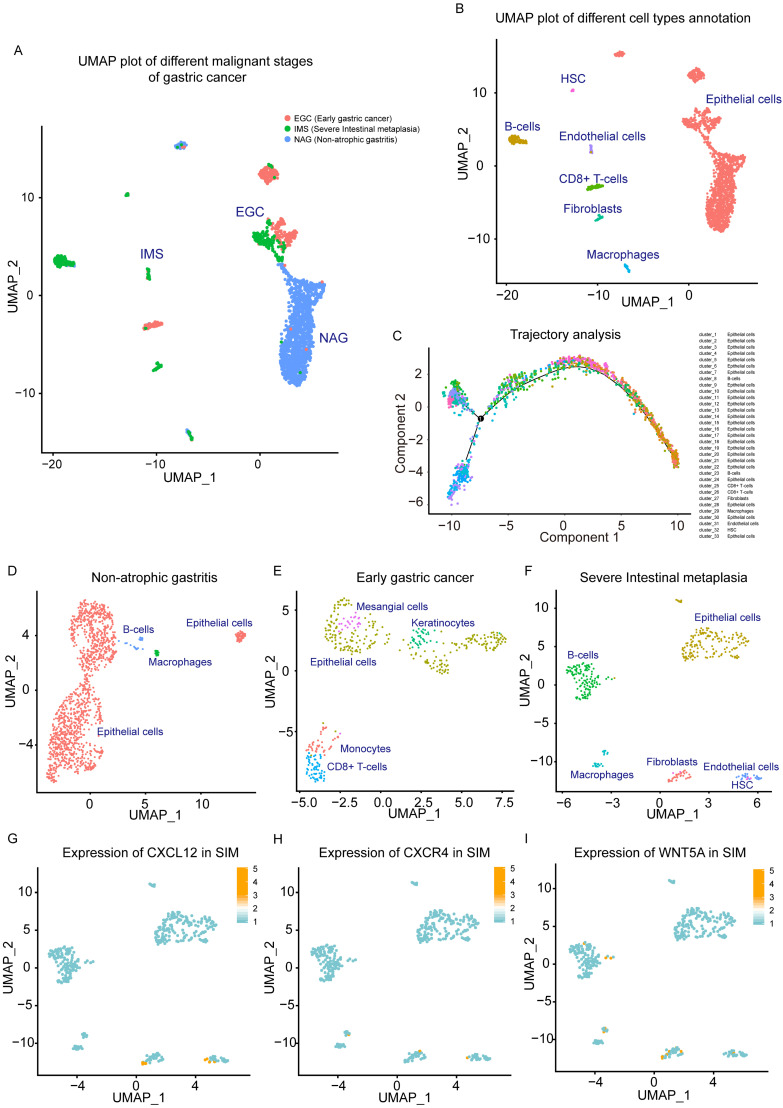
Figure 2.
Single-cell analysis of non-atrophic gastritis (NAG), early gastric cancer (EGC) and severe intestinal metaplasia (IMS) samples. (A) UMAP plot of NAG, EGC, and IMS single-cell samples. (B) NAG, EGC, and IMS single-cell samples. Cluster markers of different infiltrating cell types (C) trajectory analysis plots of different cell types. (D) UMAP plot of cell type distribution in the NAG group. (E) UMAP plot of cell type distribution in the EGC group. (F) UMAP plot of cell type distribution in the SIM group. (G) Expression of CXCL12 in SIM group. (H) CXCR4 expression in the SIM group. (I) Expression of Wnt5a in the SIM group.

