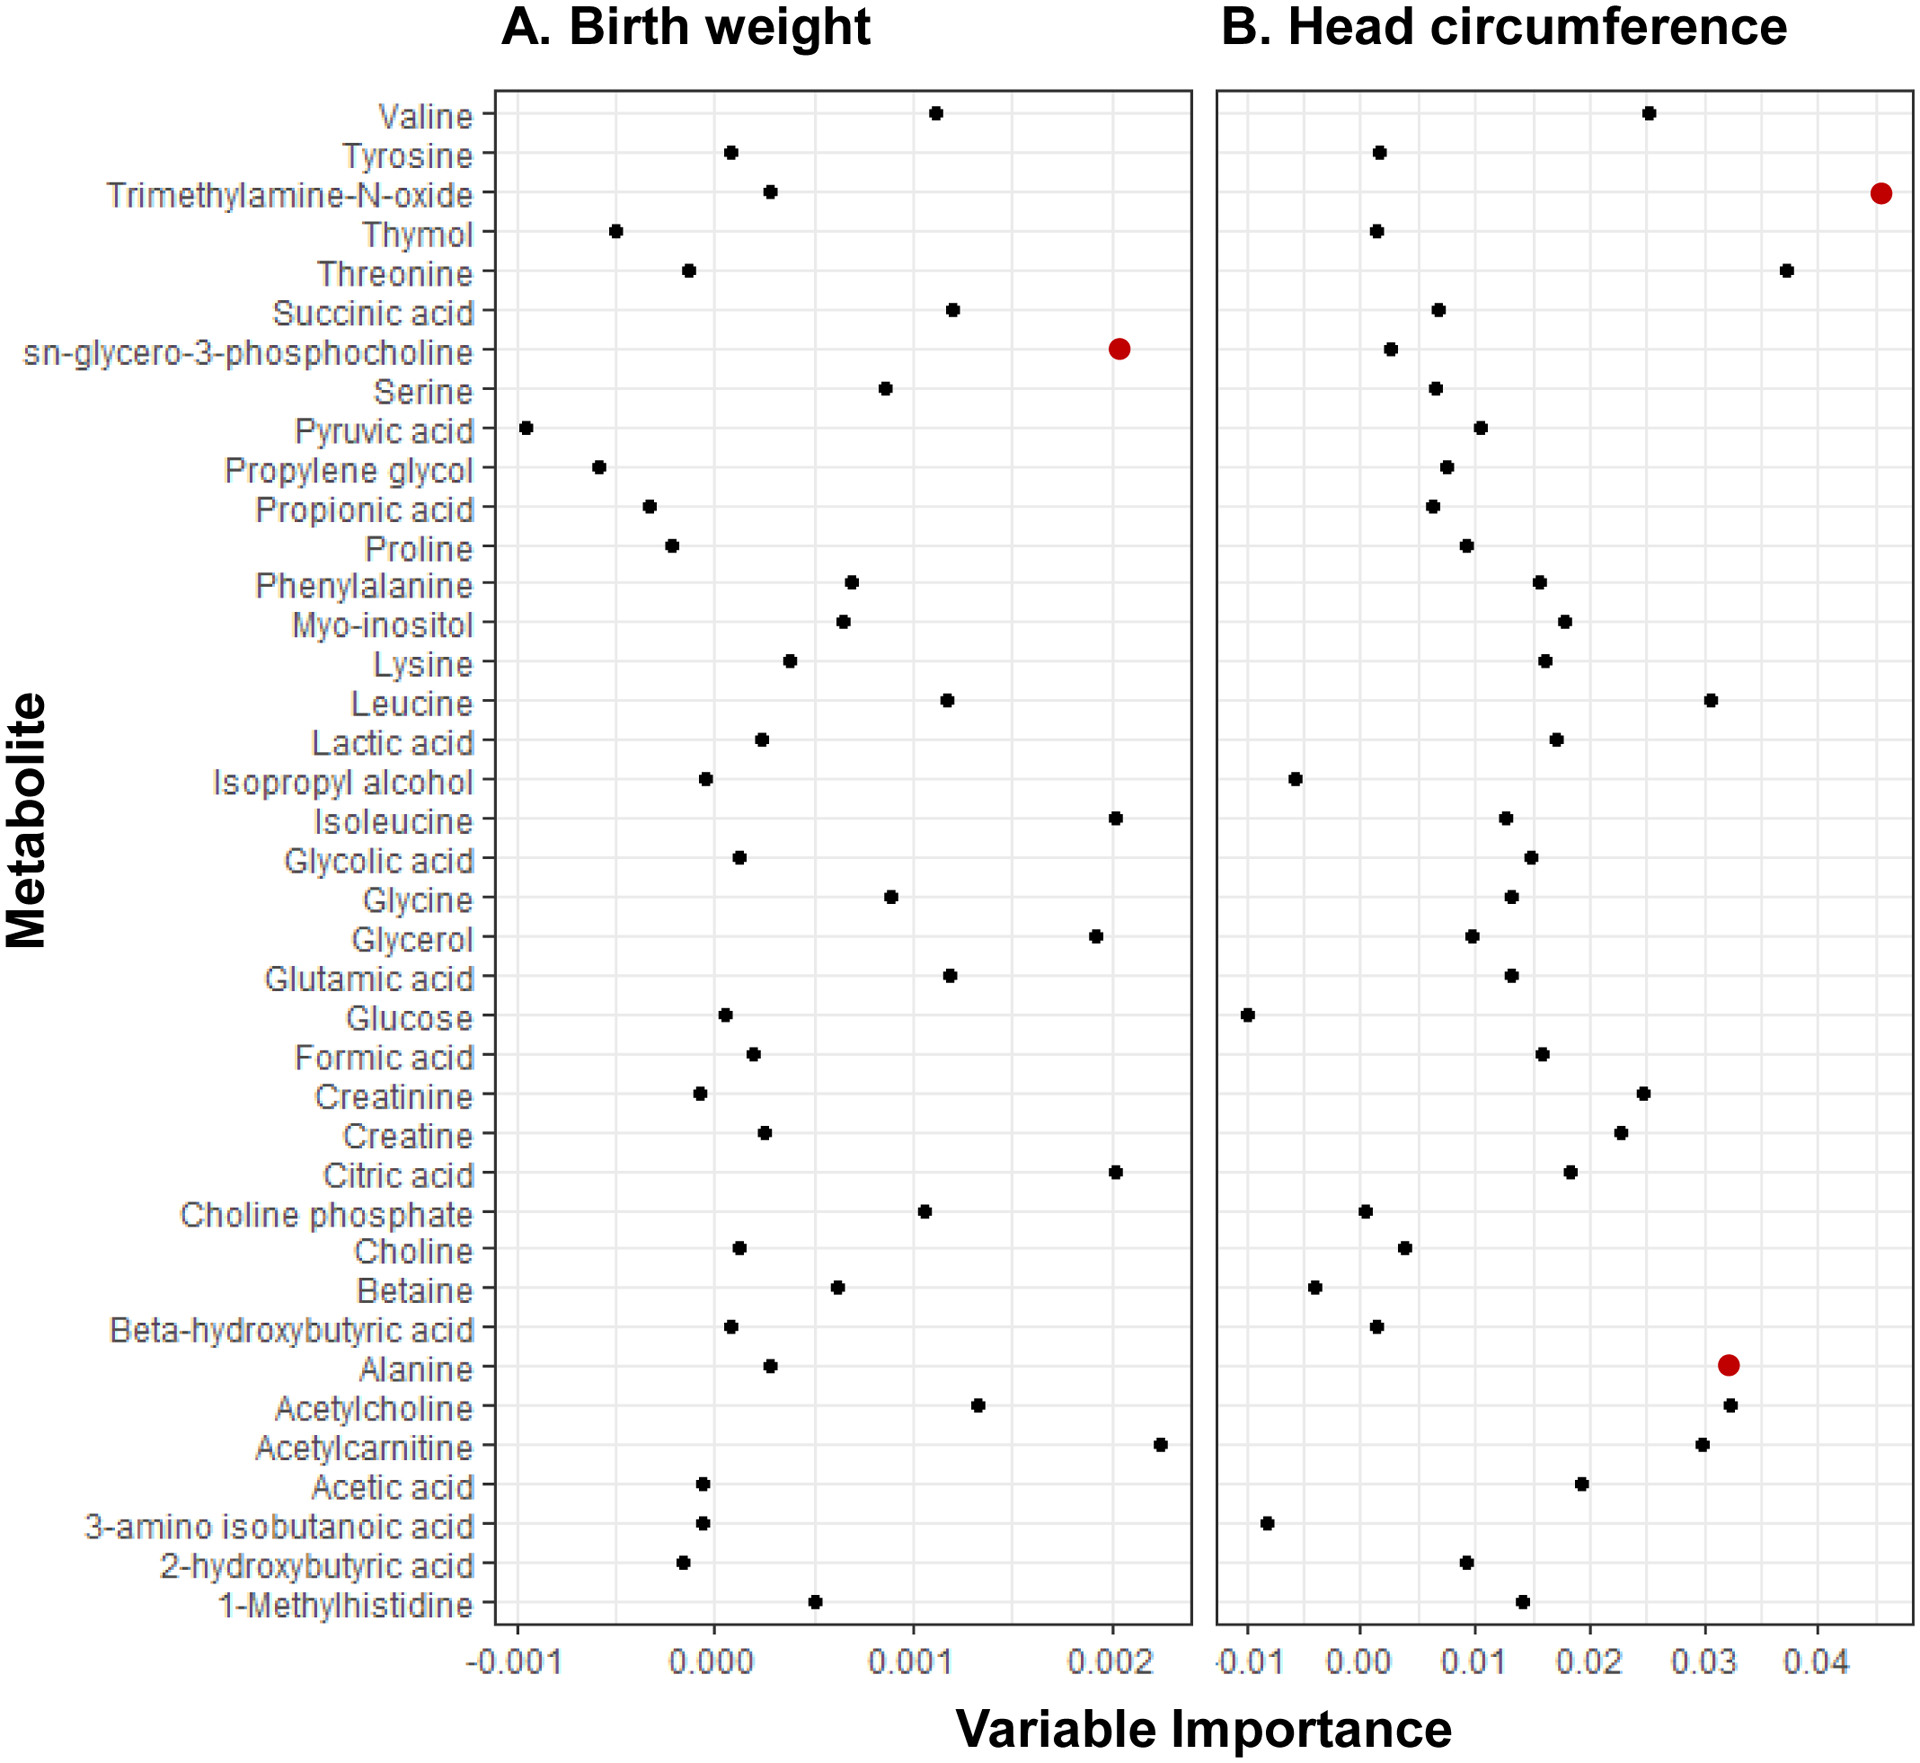
Figure 3. Random forest variable importance plots for (A) birth weight and (B) head circumference datasets.

Points in blue and red represent metabolites associated with birth outcomes at p<0.10 and p<0.05 thresholds, respectively.

Points in blue and red represent metabolites associated with birth outcomes at p<0.10 and p<0.05 thresholds, respectively.