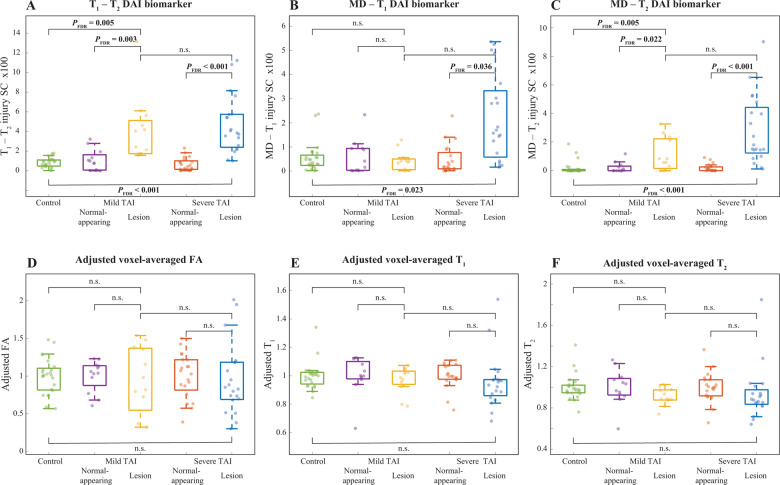
Figure 4.
Between-group comparisons of voxel-averaged and multidimensional biomarkers and histopathological measures. Box plots showing between-group differences among control corpus callosum, normal-appearing white matter in mild TAI corpus callosum, mild TAI lesions, normal-appearing white matter in severe TAI corpus callosum, and severe TAI lesions. (A) T1-T2 injury SC; (B) MD-T1 injury SC; (C) MD-T2 injury SC; (D) adjusted voxel-averaged FA; (E) adjusted voxel-averaged T1; and (F) adjusted voxel-averaged T2. All parameters are averaged across their corresponding spatial regions of interest.

