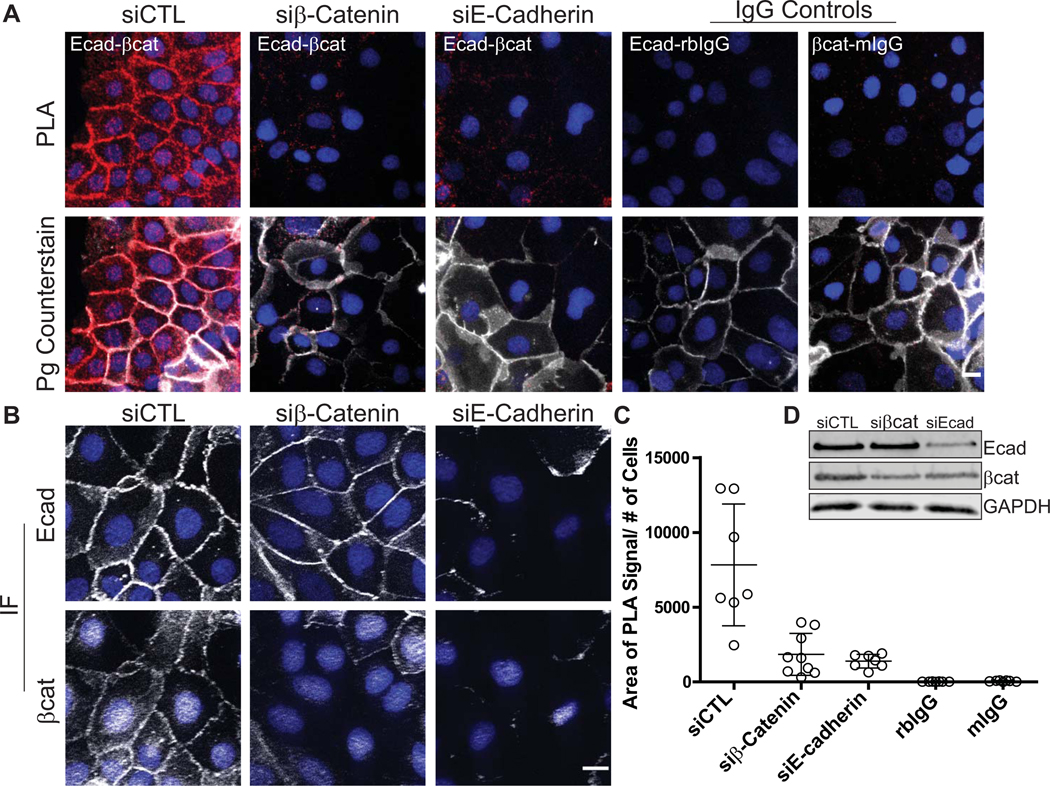
Figure 2. PLA applied to cell monolayers demonstrating protein-protein interactions in situ.
Antibodies recognizing components of the cell-cell adhesive junction, the adherens junction, are used here to demonstrate the ability to visualize proximity between two proteins and attribute a spatial signature to the interaction within the 2-dimensional cell monolayer. For a review on the cell-cell junctions, the desmosome and the adherens junction refer to Rübsam et al (Rübsam et al., 2018). A. The transmembrane protein, E-cadherin (antibody: HECD-1 mouse) and its cytoplasmic binding partner β-Catenin (antibody: C2206rabbit) demonstrated the use of PLA to reveal protein-protein interactions in situ, visualized by PLA reaction “spots” shown in red (Duolink™ In Situ Detection Reagent Red, λEx: 594, λEm: 624). Plakoglobin (antibody: 1407chicken, white), a constituent of the adherens junction and its related cell-cell junction, the desmosome, is used as an immunofluorescent counterstain to reveal the location of cell-cell borders in the monolayer to give spatial relevance to the location of the PLA reaction. DAPI labels nuclei in blue. Controls for the assay include combining each primary antibody with pre-immune sera of the opposite species used (anti-E-cadherinmouse paired with IgGrabbit (rbIgG) and β-Cateninrabbit paired with IgGmouse (mIgG)). A highly recommended control is the silencing of the proteins of interest. Note the decreased PLA signal in the siRNA silenced samples in A (siβ-Catenin, siE-Cadherin). B. Traditional immunofluorescence (IF) using the antibodies at the same concentrations as used in the PLA reaction is performed to demonstrate successful antibody binding and to observe the effect of E-cadherin and β-Catenin silencing (E-cadherin or β-Catenin, white; DAPI, blue). C. Quantification of PLA signal. Data points in the graph indicate the area of PLA signal per field/number of cells in the field. DAPI was used to determine cell number. Error bars indicate the standard deviation. ImageJ/FIJI was used for image analysis and data graphed using GraphPad Prism®. D. Western blot analysis was done in parallel to assess the efficiency of siRNA-mediated knockdown for each protein. Note that the knockdown of E-Cadherin resulted in a decrease in β-Catenin levels, reflected in the slightly lower amount of PLA signal observed in the siE-Cadherin condition. PLA images were acquired using a DMR Leica microscope with a 40X (PL Fluortar, NA 0.7) using a Hamamatsu Orca 100 CCD camera model C4742–95. Traditional immunofluorescence images were acquired using an AxioVison Z1 system (Carl Zeiss) with Apotome slide module, an AxioCam MRm digital camera, and a 40x (0.5 NA, Plan-Neofluar) objective. Scale bar = 10 μm.

