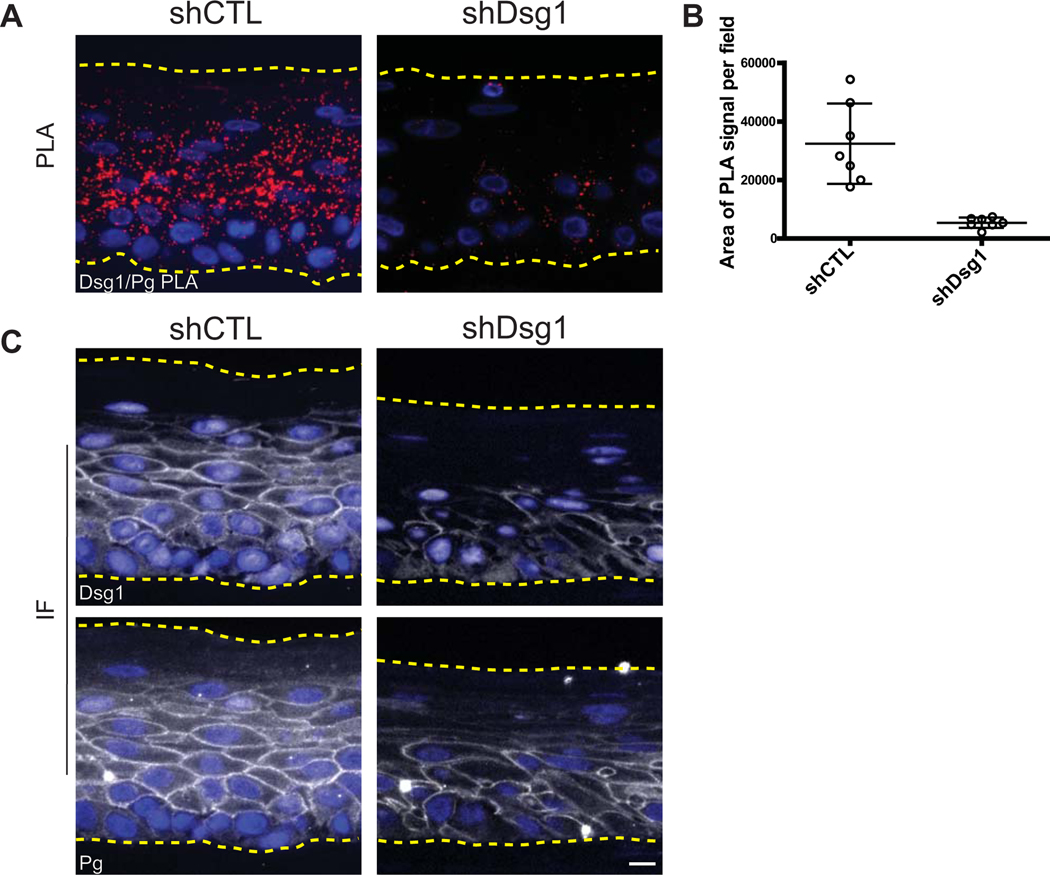
Figure 4. PLA applied to paraffin-embedded 3D organotypic cultures demonstrating protein-protein interactions in situ.
Antibodies recognizing Desmoglein 1 (Dsg1goat) and Plakoglobin (Pgmouse), two components of the cell-cell adhesive junction the desmosome, are used to demonstrate the ability to visualize proximity between two proteins. For a review on the cell-cell junctions, the desmosome and the adherens junction refer to Rübsam et al (Rübsam et al., 2018). Paraffin-embedded sections of 3D organotypic cultures that mimic the epidermal layers of human skin, generated using primary keratinocytes isolated from human foreskin were processed for PLA. Refer to Arnette et al. for a protocol on growing such cultures (Arnette et al., 2016). A. A strong PLA signal (red) is observed in the control section (shCTL), and this specific signal is lost when Dsg1 is silenced (shDsg1) (Duolink™ In Situ Detection Reagent Red, λEx: 594, λEm: 624). DAPI labels nuclei in blue. B. In 3D cross sections, using DAPI as a measure of cell number is not reliable as not every cell will have a nucleus in the cross section; therefore, the sections are quantified and plotted as the average PLA signal area/field. Data points in the graph indicate the area of PLA signal per field in a region of the tissue. Error bars indicate the standard deviation. ImageJ/FIJI was used for image analysis and data graphed using GraphPad Prism®. C. Immunofluorescence (IF) demonstrates successful binding of both antibodies in the control section, while staining is decreased in the Dsg1 knock down condition (Dsg1 or Pg in white, DAPI in blue). Images were acquired using an AxioVison Z1 system (Carl Zeiss) with Apotome slide module, an AxioCam MRm digital camera, and a 40x (0.5 NA, Plan-Neofluar) objective. Scale bar = 20 μm.

