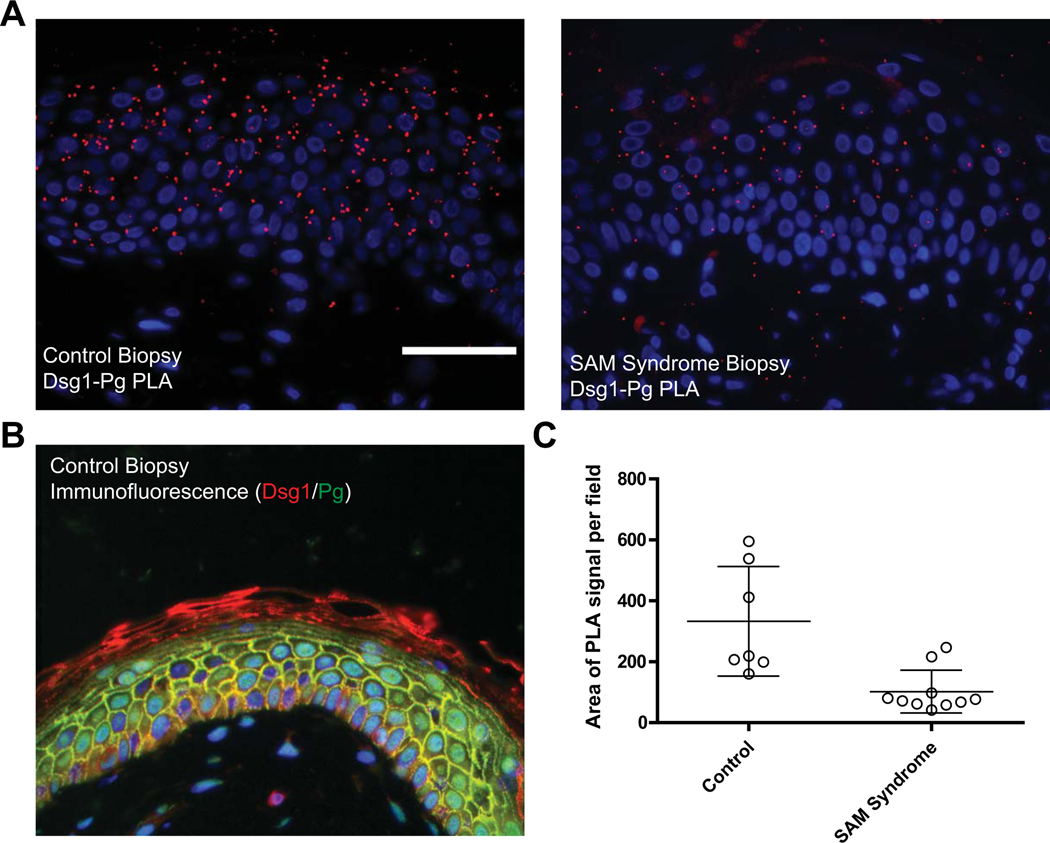
Figure 5. Use of PLA to compare protein-protein interactions in clinical tissue specimens in situ.
The interaction between the desmosomal cadherin Desmoglein 1 (Dsg1goat) and its cytoplasmic partner Plakoglobin (Pgmouse) is analyzed in a paraffin-embedded SAM syndrome patient biopsy and compared to control tissue. SAM syndrome is a skin disease associated with a loss of Dsg1 expression at the cell-cell adhesive interface (Eran Cohen-Barak et al., 2020; Samuelov et al., 2013). A. The PLA signal is clearly decreased in the SAM syndrome patient section compared to control tissue (red, Duolink™ In Situ Detection Reagent Red, λEx: 594, λEm: 624). B. Traditional immunofluorescence assay performed on control tissue is used to demonstrate successful antibody binding to both proteins analyzed by PLA (Dsg1, red; Pg, green; DAPI, blue). C. In tissue sections such as this, using DAPI (blue) as a measure of cell number is not reliable as every cell will have a nucleus in the cross section; therefore, the PLA signal is quantified and plotted as the area of PLA signal per field. Data points in the graph indicate the area of PLA signal in a region of the tissue. Error bars indicate the standard deviation. ImageJ/FIJI was used for image analysis and data graphed using GraphPad Prism®. Images were acquired using an AxioVison Z1 system (Carl Zeiss) with Apotome slide module, an AxioCam MRm digital camera, and a 40x (0.5 NA, Plan-Neofluar) objective. Scale bar = 50 μm.

