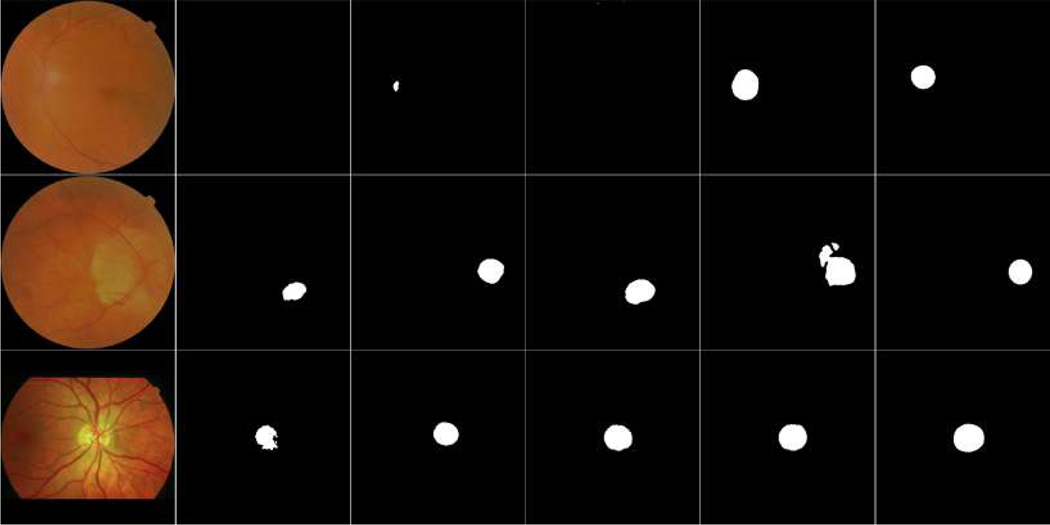
Fig. 6.
Illustration of segmentation results of the U-net model on different images. The first column showed three original fundus images, the last five columns from left to right were results of these fundus images, vessel density maps, 4-channel composite images, local disc patches, and their ground truths, respectively.

